Candlestick patterns are among the most frequently used technical tools by active futures traders. No matter the strategy―whether it is trend, rotational, or reversal―chart patterns can be valuable for position management or market timing devices.
Let’s take a look at the top three tips for trading Japanese candlestick chart patterns.
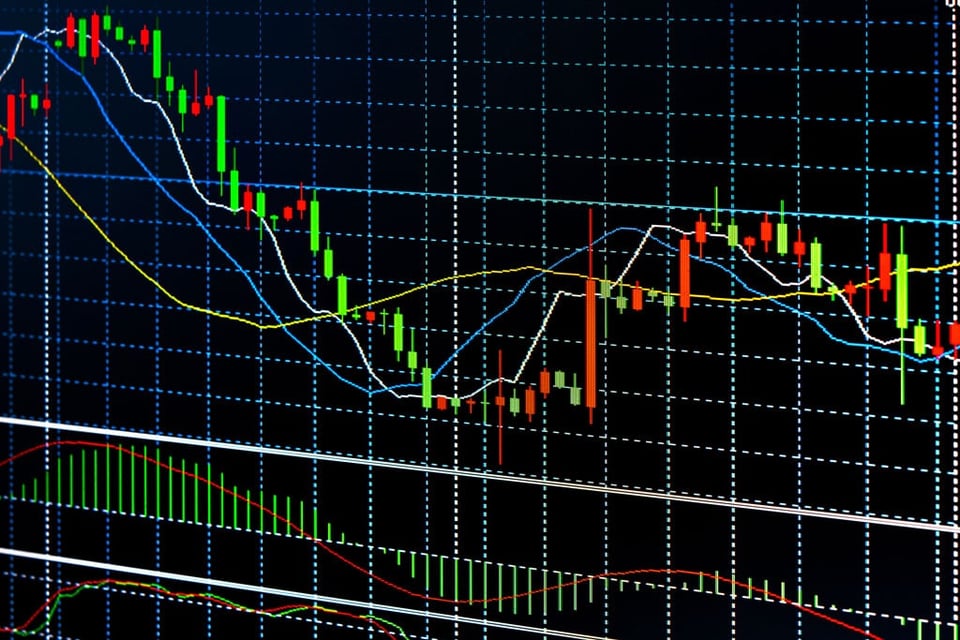
Tip No. 1: Be Aware of Volume
Trading volume is the total number of shares, contracts, or lots that have changed hands over a given period. Traded volumes may be measured on any time frame, from minute-by-minute to yearly durations. In practice, volume tells us two things about the market conditions of a security:
- High volume: High or “heavy” volumes are indicative of liquid and volatile markets. Tight bid-ask spreads and reduced slippage are common to products trading with high volumes.
- Low volume: Low volumes are associated with “slow” or “thin” markets. Lagging volume is a product of reduced participation. It leads to a lack of liquidity, wide bid-ask spreads, and disjointed price action.
Volume plays an integral role in the validity of any candlestick pattern formation. Generally speaking, if volumes are low, the likelihood of a false signal grows amid choppy, inconsistent price action. If volume spikes from low levels, the enhanced order flow could prompt an irrational, directional move. Both of these items are detrimental to a pattern’s efficacy.
Ultimately, the ideal market conditions for trading chart patterns feature consistent and robust volume. Strong participation promotes a balanced order flow and even-keeled price action: If volumes are light or a rush of participation is expected, it is important to take these elements into account when attempting to trade a chart pattern.
Tip No. 2: Identify Market State
Before implementing any technical strategy, it is imperative to first identify market state, which is the current behavior of a product’s price action. It can give us clues as to what price may or may not do moving forward. A market’s state may be classified in three ways:
- Trending: A market is trending when it makes a series of periodic higher highs or lower lows.
- Rotational: Rotational or “range-bound” markets trade within an established range for an extended period of time.
- Pending reversal: Markets pending reversal show signs of price exhaustion near the upper or lower extreme of a prolonged bullish or bearish trend.
If you’re going to trade Japanese candlestick patterns successfully, then properly interpreting market state is key. Fortunately, many of the formations themselves give us clues as to how a market is behaving. Here are examples of patterns commonly found in each type of market state:
| State | Patterns |
|---|---|
| Trend | Doji stars, hanging man, inverted hammer |
| Rotational | Dojis, inside candles, channels |
| Reversal | Hammers, bearish/bullish engulfing, morning/evening stars |
With chart pattern trading, it is important that the formation complements the market state. For instance, trading morning or evening stars near the median of a range-bound market has limited odds of success, as does betting on bullish trend extension amid the appearance of dark cloud cover.
Any trades are educational examples only. They do not include commissions and fees.
Tip No. 3: Always Seek Confirmation
In technical analysis, confirmation is the act of validating one indicator with another indicator(s). Seeking confirmation is a solid strategic practice when trading candlestick patterns in that the supplementary evidence may give credence to—or detract from—a formation’s potential effectiveness. However, be forewarned: Adding too many indicators can hamper decision-making and lead to analysis paralysis.
To illustrate how confirmation works, assume that Carey is an intraday candlestick pattern trader who uses stochastics to verify whether a market is short-term overbought or oversold. At the moment, Carey is scalping CME corn futures using one-, five-, and 30-minute charts. The following scenario illustrates how Carey confirms chart patterns in the live market:
- ZC is priced at 525’9, one tick above the weekly high (525’8).
- A bearish engulfing pattern sets up on the 30-minute ZC chart.
- The stochastic oscillator reads 89, firmly in overbought territory.
In this case, the bearish engulfing pattern and stochastic reading (89) both suggest that a reversal may be in the offing. The additional evidence provided by the stochastic oscillator adds credence to the chart formation, suggesting that Carey may want to consider shorting the ZC contract. Had the stochastic indicated neutral or oversold conditions, the bearish engulfing pattern would be up for further scrutiny.


