• Skip to primary navigation
  • Skip to content
  • Skip to footer
StoneX®

Trade Futures, Spreads and Options with Confidence.

Top Navigation

  • Open a Futures Account
  • Sign Up
  • Log in
  • 1.800.800.3840

Primary Navigation Menu

  • About
    • Who We Are
    • Services
    • Risk Disclosure
    • COVID-19
  • Trade
    • Broker-Assisted
    • Self-Directed / Online
    • Request Pricing
  • Hedge
    • Ag Marketing Plan
    • WASDE Analysis
    • Grain Resources
    • Livestock / Dairy Resources
    • Request Pricing
  • Invest
    • Automated Strategies
    • Managed Futures
    • Request Pricing
  • Advisories
    • GENERAL / FUNDAMENTAL
      • DT Newsletter
      • Insider Market Advisory
      • Turner’s Take Newsletter & Podcast
    • TECHNICAL ANALYSIS
      • The Cullen Outlook
      • Data Feed Trade
      • Jarboe Trading Journal
      • Trade Spotlight
    • AG MARKETING
      • Cattleman’s Advisory
      • Technical Ag Knowledge
      • Turner’s Take Ag Marketing
    • THIRD-PARTY RESOURCES
      • CFRN
      • Moore Research Center, Inc. (MRCI)
      • OptionWorks®
  • Education
    • CME Group Resource Center
    • CME Group Offers
    • Guides
    • Frequently Asked Questions
    • Order Entry Handbook
  • Blog
    • Futures 101
    • Ag Marketing
    • Tips & Strategies
    • Trading Advisories
  • Resources
    • Trading Software
    • Quotes and Charts
    • Futures Calendars
    • Contract Specifications
    • Margin Requirements
    • Futures Calculator
  • Accounts
    • Apply
    • Access My Account
    • Funding
  • Contact
 

Tips for Using a Candlestick Chart in Futures Trading

May 26, 2020 by Daniels Trading| Tips & Strategies

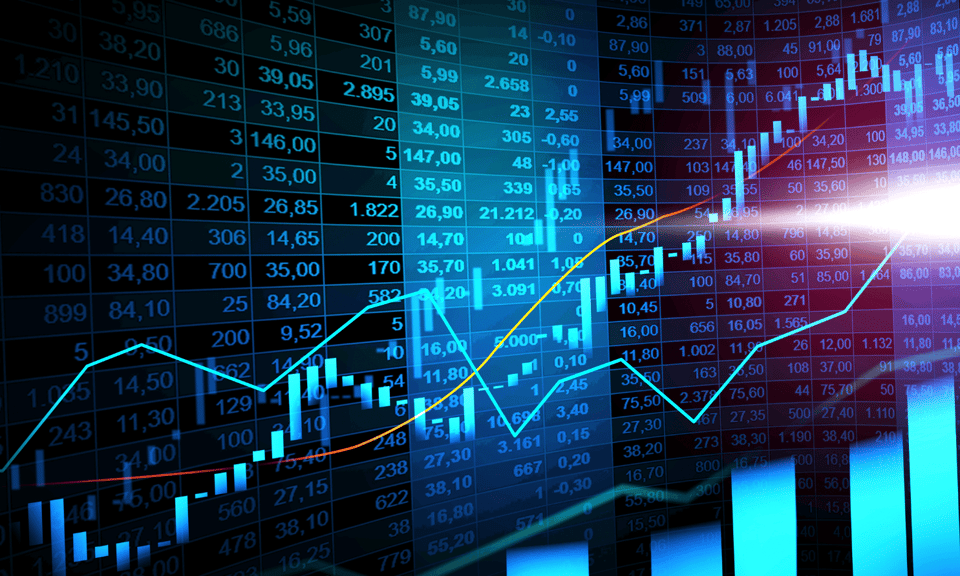
Since Steve Nison’s introduction of the candlestick chart in the early 1990s, western traders have made it a staple of technical analysis. Regardless of asset class or product, scores of aficionados view Japanese candlesticks as an ideal way of interpreting market behavior. If studying price action piques your interest, you have likely heard of candlestick charting.

In comparison to OHLC, line, or point-and-figure charts, candlesticks offer an abundance of pertinent information. Data is presented in a user-friendly manner, greatly boosting the speed of interpretation. Because of this robust functionality, the candlestick chart has become the industry standard for futures market technicians. Keep reading for a few tips on how to optimize your experience with this powerful analytical device.

Align Your Periodicity

No matter which type of pricing chart you use, it is critical that the chart’s periodicity is in alignment with the trading style. For instance, the decision-making of an intraday scalper relies on movements of price within ultra-short time frames. Accordingly, weekly, monthly, and yearly intervals are of little use; a one-minute or 250-tick candlestick chart is far more suitable.

One tried-and-true way of optimizing your technical studies is to integrate multiple time frame analysis via candlestick charts. Viewing price action simultaneously on different time frames is a great way to place volatility into a manageable context. The visual nature of candlesticks promotes an easy recognition of patterns and trends . By observing common or conflicting data on unique intervals, you may rapidly fine-tune market entry and exit points.

Want technical trading tips? Download our free guide 12+ Candlestick Formations Every Technical Trader Should Know today!

Candlestick Charts Are Indicator-Friendly

Perhaps the single greatest benefit of being a modern futures trader is the availability of technology. Software trading platforms automatically chart streaming price data, perform intricate calculations, and apply indicators. Long gone are the days of graph paper and pencil. All the technical trader needs to do is choose an indicator (or indicators) and interpret the data.

In the case of the candlestick chart, indicators are best applied as overlays. A chart overlay is simply the transposition of such indicators as moving averages, Bollinger Bands, and Fibonacci tools on existing candlesticks. When a trader does this, market direction and pricing momentum become quickly discernible. This is a key advantage of candlesticks because almost any technical indicator can be applied to the chart without muddling the presentation.

Avoid Analysis Paralysis

As we covered earlier, the Japanese candlestick chart is a fantastic tool for delivering a lot of information quickly. However, it is critical to avoid a hazard that many traders fall victim to: analysis paralysis.

Analysis paralysis occurs when a trader attempts to focus on too many pieces of information at one time. The result is an inability to be decisive and act in a timely fashion.

Although candlesticks are great for applying various indicators and multiple time frame analysis, it’s important to not get carried away by their utility. Stick with the indicators and time frames that complement your strategic objectives. In doing so, you will be able to streamline decision-making and avoid analysis paralysis.

Want to Learn More About Candlestick Chart Functionality?

The Japanese candlestick chart is a powerful technical device that has countless applications for active futures trading. No matter what type of trader you are, candlesticks are certainly worth a look.
If you’re interested in exploring the strategic value of this time-honored approach to the markets, take a look at Daniels Trading’s free e-book 12+ Candlestick Formations Every Technical Trader Should Know. Featuring tips on how to read candlestick charts, identify patterns, and apply the concepts to active trading, it’s a straightforward introduction designed for anyone interested in boosting their analytical game.

Ready to think like a technical trader? Download our free guide to learn how to identify chart formations and take action when the time is right.

Filed Under: Tips & Strategies

About Daniels Trading

Daniels Trading is division of StoneX Financial Inc. located in the heart of Chicago’s financial district. Established by renowned commodity trader Andy Daniels in 1995, Daniels Trading was built on a culture of trust committed to a mission of Independence, Objectivity and Reliability.

Risk Disclosure

The StoneX Group Inc. group of companies provides financial services worldwide through its subsidiaries, including physical commodities, securities, exchange-traded and over-the-counter derivatives, risk management, global payments and foreign exchange products in accordance with applicable law in the jurisdictions where services are provided. References to over-the-counter (“OTC”) products or swaps are made on behalf of StoneX Markets LLC (“SXM”), a member of the National Futures Association (“NFA”) and provisionally registered with the U.S. Commodity Futures Trading Commission (“CFTC”) as a swap dealer. SXM’s products are designed only for individuals or firms who qualify under CFTC rules as an ‘Eligible Contract Participant’ (“ECP”) and who have been accepted as customers of SXM. StoneX Financial Inc. (“SFI”) is a member of FINRA/NFA/SIPC and registered with the MSRB. SFI does business as Daniels Trading/Top Third/Futures Online. SFI is registered with the U.S. Securities and Exchange Commission (“SEC”) as a Broker-Dealer and with the CFTC as a Futures Commission Merchant and Commodity Trading Adviser. References to securities trading are made on behalf of the BD Division of SFI and are intended only for an audience of institutional clients as defined by FINRA Rule 4512(c). References to exchange-traded futures and options are made on behalf of the FCM Division of SFI.

Trading swaps and over-the-counter derivatives, exchange-traded derivatives and options and securities involves substantial risk and is not suitable for all investors. The information herein is not a recommendation to trade nor investment research or an offer to buy or sell any derivative or security. It does not take into account your particular investment objectives, financial situation or needs and does not create a binding obligation on any of the StoneX group of companies to enter into any transaction with you. You are advised to perform an independent investigation of any transaction to determine whether any transaction is suitable for you. No part of this material may be copied, photocopied or duplicated in any form by any means or redistributed without the prior written consent of StoneX Group Inc.

© 2023 StoneX Group Inc. All Rights Reserved

Subscribe To The Blog

Footer

Site Navigation

  • Frequently Asked Questions
  • About Us
  • Customer Reviews
  • Contact Us
  • Futures Blog
  • Open a Futures Trading Account
  • Media Resources
  • Fund Your Account
  • Legal Notices

Contact Us

StoneX Financial Inc.
Daniels Trading Division
230 South LaSalle Suite 10-500
Chicago, IL 60604
+1.312.706.7600 Local / Int'l
+1.800.800.3840 Toll-Free
+1.312.706.7605 Fax

Connect with Us

Risk Disclosure

The StoneX Group Inc. group of companies provides financial services worldwide through its subsidiaries, including physical commodities, securities, exchange-traded and over-the-counter derivatives, risk management, global payments and foreign exchange products in accordance with applicable law in the jurisdictions where services are provided. References to over-the-counter (“OTC”) products or swaps are made on behalf of StoneX Markets LLC (“SXM”), a member of the National Futures Association (“NFA”) and provisionally registered with the U.S. Commodity Futures Trading Commission (“CFTC”) as a swap dealer. SXM’s products are designed only for individuals or firms who qualify under CFTC rules as an ‘Eligible Contract Participant’ (“ECP”) and who have been accepted as customers of SXM. StoneX Financial Inc. (“SFI”) is a member of FINRA/NFA/SIPC and registered with the MSRB. SFI does business as Daniels Trading/Top Third/Futures Online. SFI is registered with the U.S. Securities and Exchange Commission (“SEC”) as a Broker-Dealer and with the CFTC as a Futures Commission Merchant and Commodity Trading Adviser. References to securities trading are made on behalf of the BD Division of SFI and are intended only for an audience of institutional clients as defined by FINRA Rule 4512(c). References to exchange-traded futures and options are made on behalf of the FCM Division of SFI.

Trading swaps and over-the-counter derivatives, exchange-traded derivatives and options and securities involves substantial risk and is not suitable for all investors. The information herein is not a recommendation to trade nor investment research or an offer to buy or sell any derivative or security. It does not take into account your particular investment objectives, financial situation or needs and does not create a binding obligation on any of the StoneX group of companies to enter into any transaction with you. You are advised to perform an independent investigation of any transaction to determine whether any transaction is suitable for you. No part of this material may be copied, photocopied or duplicated in any form by any means or redistributed without the prior written consent of StoneX Group Inc.

© 2023 StoneX Group Inc. All Rights Reserved

  • Risk Disclosure
  • Privacy Policy
  • California Residents Privacy Notice
  • Terms of Use
  • Back to top