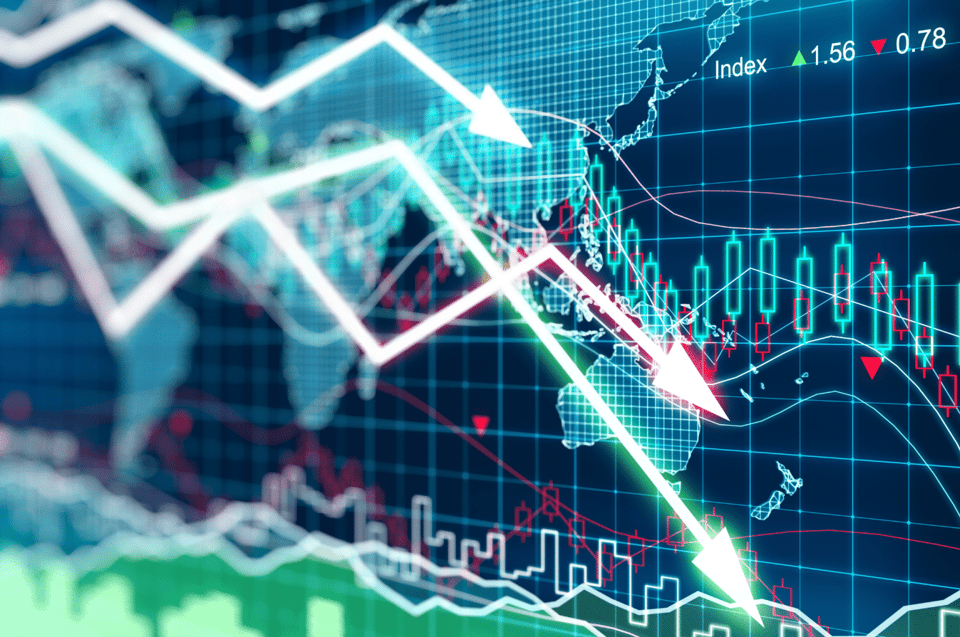
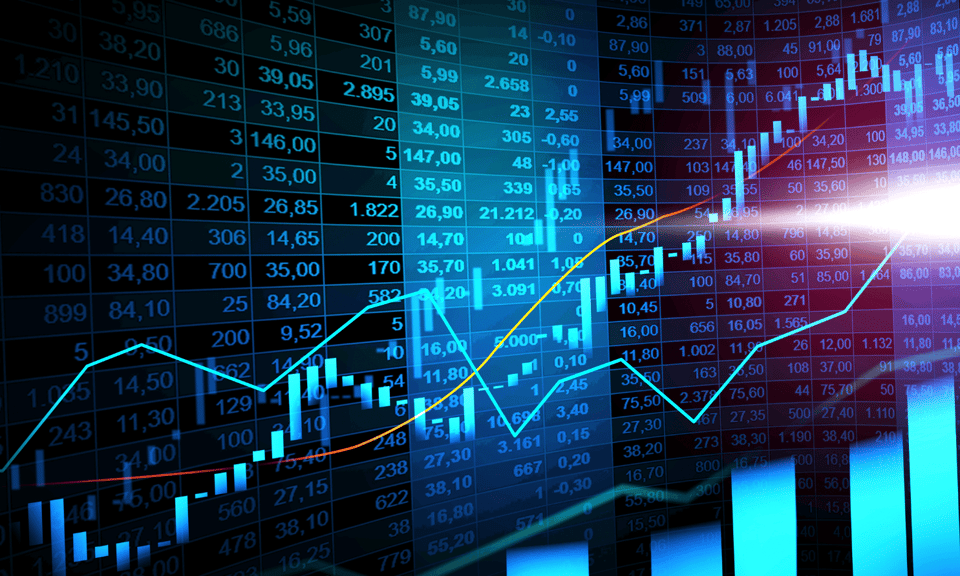
In the contemporary marketplace, technical analysis is the driving force behind a broad spectrum of trading strategies. Whether you’re engaging the stock, currency, or futures markets, an abundance of indicators stand ready to aid in the crafting of strong trade-related decisions.
When it comes to the fast-paced arena of day trading, traders use technical analysis in many ways. A few of the most important are identifying the presence of a trend, forecasting future price action, and determining points for market entry or exit. In order to accomplish these tasks efficiently, a trade must implement three unique types of technical indicators for day trading:
- Lagging: Lagging indicators are often used to place short-term price action into the proper perspective. Through implementing studies with greater periodicities, lagging indicators reduce the impact of short-term market noise, facilitating true trend identification. The moving average is one example of a lagging indicator commonly used in day trading.
- Leading: Leading indicators are designed to quantify or predict future moves in price. In order to stay current, they use periods with much shorter durations, typically on an intraday scale. Oscillators such as Stochastics or the Relative Strength Index (RSI) are examples of leading indicators.
- Confirming: Confirmation is the act of one indicator reinforcing a signal provided by another. This is best accomplished by using different types of technical indicators, including those from both the lagging and leading classifications. In the event that separate indicators show similar readings, then convergence is present. If not, divergence is said to be occurring, bringing the validity of each study into question.
Placing evolving price action into a useful context is the key to using any collection of technical indicators for day trading. Being able to identify the presence of a trend, determine its validity on multiple time frames, and derive exact price points for optimal market entry/exit is the name of the game.
Technical Indicators for Day Trading in Action
It’s important to remember that no technical indicator is infallible. Simply put, a proverbial holy grail of trading does not exist. Regardless of this fact, traders can use various technical indicators for day trading in concert with one another to increase accuracy and the probability of success.
Utilizing more than one technical to analyze a market is known as filtering. Filters are used to form concrete trade ideas while mitigating the negative impacts of market noise. Identifying false breakouts, as well as weak bottoms and tops, are a few reasons for applying filters.
Here is an example of a robust day trading strategy involving each type of indicator. Assume that a trend-following approach is being applied to the E-mini S&P 500 futures contract:
- Lagging: The use of a 20-day simple moving average (SMA) establishes the presence of a prevailing intermediate-term bearish trend in the E-mini S&P 500. The value of the 20-day SMA is decreasing, producing a downward sloping plotted line on the pricing chart.
- Leading: Short-term momentum oscillators are implemented to place intraday price action into context. In this case, a one-hour RSI is reading 94, suggesting the E-mini S&P 500 is currently overbought. Accordingly, an exact price point for a sell order is determined.
- Confirming: To confirm the presence of the trend suggested by the 20-day SMA, a Fibonacci retracement of the previous session’s range is applied as a filter. Prices remain beneath the 38% Fibonacci retracement, reinforcing the validity of the downtrend. Subsequently, the lagging, leading, and filter are converging. Confirmation has been achieved, suggesting an intraday short position is warranted.
The above scenario is only one example of how to integrate multiple technical indicators for day trading into a comprehensive plan for the markets. Many strategies of this kind exist, including moving average crossovers, chart patterns, market profile, and order flow.
Getting Started With Technical Analysis
Technical analysis is a great way of crafting strong trade-related decisions and developing a precise, bold plan for the markets. For more information on how to think like a technical trader, contact one of our StoneX experts.

