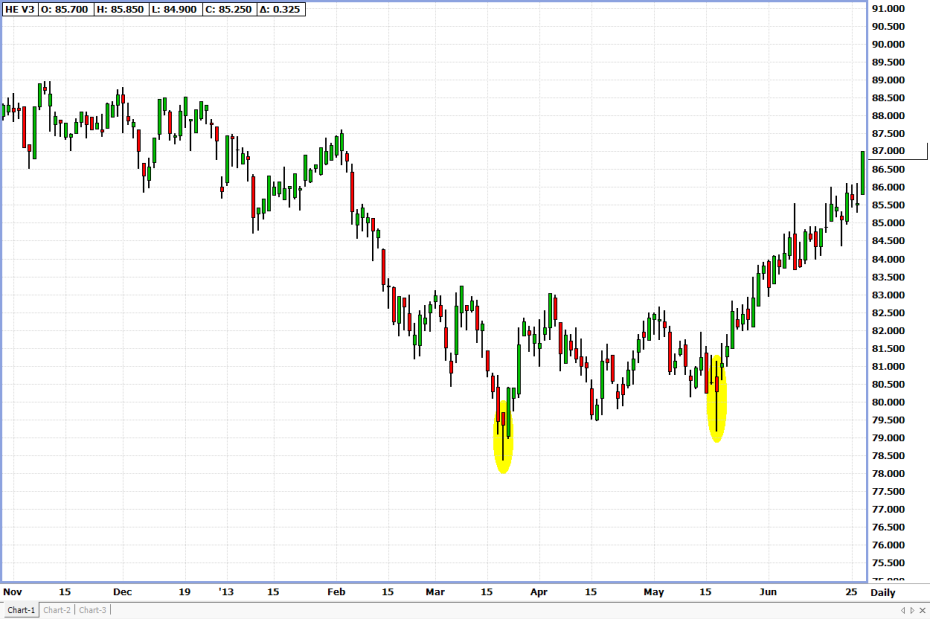
Bullish Hammers, as the name suggests, is a signal on a chart that alerts you to be on the lookout for a market that is setting up to reverse and trade higher! I’ve highlighted in yellow this exciting candlestick set up in the chart below.
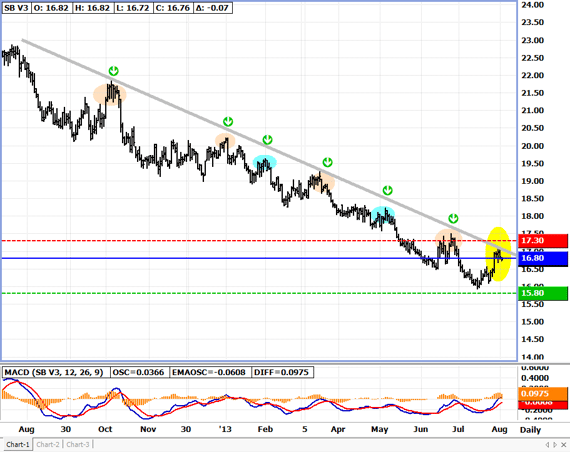
Here are some characteristics with an image of its appearance:
- It is a reversal formation
- It is typically the strongest after a significant move to the downside
- The Bullish Hammer candle starts with a big move to the downside but the market retraces back to the upside, most often pretty close to where we opened
- There is little to no “upper wick” indicating the market failed to trade higher at any point in the trading day
- This formation is indicating that there was an unsustainable sell-off in the day where buyers quickly took control after a failed attempt by sellers to take the market lower. This price action is what makes the body small and compact near or at the top of the candle with the long tail
- It is ideal, and generally preferred, when the bottom wick is 2x the size of the “body” of the candle
- It can be used to signal for traders looking to buy that they should be paying close attention as the downtrend is losing momentum.
This is one of many formations that I identify and send out to my subscribers on a regular basis. I include trade ideas accompanied with risk and objective points for you to keep an eye on!
If you like to trade these types of set-ups and you enjoy technical analysis, click the link, join the team…and Let’s Figure Out Some Charts!!!
