• Skip to primary navigation
  • Skip to content
  • Skip to primary sidebar
  • Skip to footer
Daniels Trading

Trade Futures, Spreads and Options with Confidence.

Top Navigation

  • Open a Futures Account
  • Sign Up
  • Log in
  • 1.800.800.3840

Primary Navigation Menu

  • About
    • Who We Are
    • Services
    • Risk Disclosure
    • COVID-19
  • Trade
    • Broker-Assisted
    • Self-Directed / Online
    • Request Pricing
  • Hedge
    • Ag Marketing Plan
    • WASDE Analysis
    • Grain Resources
    • Livestock / Dairy Resources
    • Request Pricing
  • Invest
    • Automated Strategies
    • Managed Futures
    • Request Pricing
  • Advisories
    • GENERAL / FUNDAMENTAL
      • DT Newsletter
      • Insider Market Advisory
      • Turner’s Take Newsletter & Podcast
    • TECHNICAL ANALYSIS
      • The Cullen Outlook
      • Data Feed Trade
      • Jarboe Trading Journal
      • Trade Spotlight
    • AG MARKETING
      • Cattleman’s Advisory
      • Technical Ag Knowledge
      • Turner’s Take Ag Marketing
    • THIRD-PARTY RESOURCES
      • CFRN
      • Moore Research Center, Inc. (MRCI)
      • OptionWorks®
      • TASMarketProfile.com
  • Education
    • CME Group Resource Center
    • CME Group Offers
    • Small Exchange Resources
    • Guides
    • Frequently Asked Questions
    • Order Entry Handbook
  • Blog
    • Futures 101
    • Ag Marketing
    • Tips & Strategies
    • Trading Advisories
  • Resources
    • Trading Software
    • Quotes and Charts
    • Futures Calendars
    • Contract Specifications
    • Margin Requirements
    • Futures Calculator
  • Accounts
    • Apply
    • Access My Account
    • Funding
  • Contact
Home / Candlestick

Candlestick

OHLC Charts vs. Candlestick Charts: Which Is Better?

OHLC Charts vs. Candlestick Charts: Which Is Better?

June 3, 2022 by Daniels Trading

One of the first steps to becoming a competent technical trader is to choose a suitable chart type. Active traders enjoy a variety of alternatives, from basic line charts to more sophisticated constructs such as point and figure charts. With this many choices, novice market technicians can be easily overwhelmed. Let’s take at the ins… Read more.

Top Tips for Trading Candlestick Patterns

Top Tips for Trading Candlestick Patterns

April 1, 2021 by Daniels Trading

Candlestick patterns are among the most frequently used technical tools by active futures traders. No matter the strategy―whether it is trend, rotational, or reversal―chart patterns can be valuable for position management or market timing devices. Let’s take a look at the top three tips for trading Japanese candlestick chart patterns. Tip No. 1: Be Aware… Read more.

Learn How to Read Candlestick Patterns Like a Pro

Learn How to Read Candlestick Patterns Like a Pro

March 15, 2021 by Daniels Trading

In contemporary technical analysis, candlestick patterns are go-to indicators for legions of active traders. From the doji to the evening star, these formations are applied to every conceivable market. That is one of the key benefits of using Japanese candlestick chart patterns: The formations are readily discernible.

Understanding Chart Patterns Trading vs. Indicators

Understanding Chart Patterns Trading vs. Indicators

October 15, 2020 by Daniels Trading

Chart patterns trading is often equated to buying and selling at the direction of technical indicators. However, although chart patterns are considered to be technical tools, they differ in many ways from indicators. If you’re in the process of becoming a market technician, then it’s important to understand the functionality, pros, and cons of both… Read more.

Tips for Using a Candlestick Chart in Futures Trading

Tips for Using a Candlestick Chart in Futures Trading

May 26, 2020 by Daniels Trading

Since Steve Nison’s introduction of the candlestick chart in the early 1990s, western traders have made it a staple of technical analysis. Regardless of asset class or product, scores of aficionados view Japanese candlesticks as an ideal way of interpreting market behavior. If studying price action piques your interest, you have likely heard of candlestick… Read more.

Bullish Engulfing Pattern Defines Market Direction

Bullish Engulfing Pattern Defines Market Direction

October 11, 2012 by Burton Schlichter

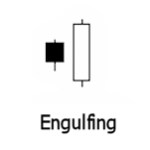
Written by DeWayne Reeves of CFRN.net. Burton Schlichter is a partner and featured broker at CFRN.net. One of the easiest candlestick signals to spot besides our consummate favorite the Doji, is the Bullish Engulfing Pattern. This is one of the 12 primary signals taught to me by candlestick mentor, Steve Bigelow. A candlestick purist might… Read more.

Primary Sidebar

Get Blog Updates

Subscribe to our blog and receive a daily email with information on market insights, trading tips & strategies.

Trustpilot

Footer

Site Navigation

  • Frequently Asked Questions
  • About Us
  • Customer Reviews
  • Contact Us
  • Futures Blog
  • Open a Futures Trading Account
  • Media Resources
  • Fund Your Account
  • Legal Notices

Contact Us

StoneX Financial Inc.
Daniels Trading Division
230 South LaSalle Suite 10-500
Chicago, IL 60604
+1.312.706.7600 Local / Int'l
+1.800.800.3840 Toll-Free
+1.312.706.7605 Fax

Connect with Us

Trustpilot
Risk Disclosure
  • Risk Disclosure
  • Privacy Policy
  • California Residents Privacy Notice
  • Terms of Use
  • Back to top
 

Loading Comments...
 

You must be logged in to post a comment.