Although traders cannot predict the future, they must make intelligent guesses as to what the future holds. A standard approach used in option evaluation is to look at the past. What has historically been the volatility of a certain commodity?
If for instance, the volatility of Treasury Bonds has been no higher than 25% over the last ten years, then a guess of 30% is somewhat impractical. Based upon the past ten years, 25% or lower proves to be more realistic value for the volatility.
There are a number or ways to calculate the historical volatility. The first thing to determine is the time frame. Do you want to study the last ten days, six months, or five years? What length of time is required to obtain an accurate picture? Generally, traders tend to start looking at volatility over a long time, at least ten years. This allows them to identify short-term deviations from normal activity. However, you must not overlook the short-term volatility either. If a commodity has averaged 25% volatility over the last year, but only 15% over the past thirty days, you may want to adjust the volatility estimates to accommodate the most recent data. Rather than using a figure of 25%, adjusting the figure to 20% as the midpoint may prove more accurate.
Once you establish a time frame, you need to determine the price intervals. Volatility can vary greatly based on the interval. For example, you may decide to monitor the volatility of the last ten weeks measuring the price changes at the close of each day. This figure can be quite different from that of the price changes at the end of each week. Prices can fluctuate wildly from day to day, but finish the week unchanged. When this happens, volatility for the daily price changes is higher than that of the weekly price changes.
You may think that there are an infinite number of ways to calculate the historical volatility. However, as long as price changes are measured at regular intervals, the annualized volatilities resulting from these intervals are usually very similar.
FutureSource calculates the historical volatility based on a default value of 20 for the number of periods, and uses the closing price. You may alter this to use any number greater than 1 for the close. The historical volatility displays in simple percentage values.

Properties
Period: the number of bars, or period, used to calculate the study. FutureSource calculates the historical volatility based on a default value of 20 for the number of periods, and uses the closing price. You may alter this to use any number greater than 1 for the close. The historical volatility displays in simple percentage values.
Aspect: The Symbol field on which the study will be calculated. Field is set to “Default”, which, when viewing a chart for a specific symbol, is the same as “Close”.
Computing Historic Volatility
The calculation for the historical volatility is rather involved. The number of periods per year vary depending on the type of price chart used for the study. The following table lists the number of periods for each type of chart:
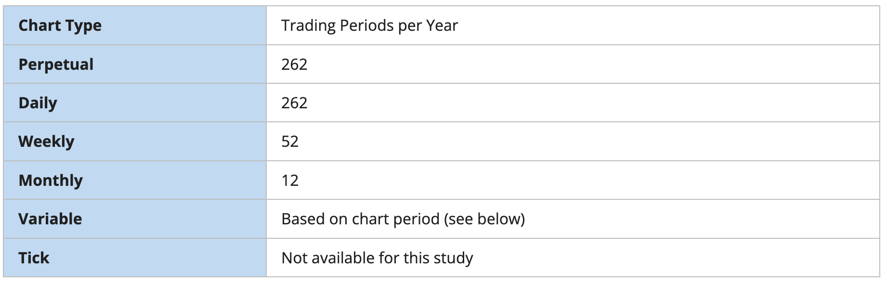
Calculate the Number of Trading Periods Per Year
When using variable charts, you must first calculate the number of trading periods per year. To do this, you must determine the trading time of the selected commodity. The formula is as follows:
TP = (Tt / Pn) * 262
TP is the total number of trading periods per year.
Tt is the total trading time in a day.
Pn is the length of the period.
262 is the number of weekdays per year.
For instance, the S&P 500 trades from 8:30 a.m. to 15:15 or 3:15 p.m. That is a total trading time of 6 hours and 45 minutes. On a variable chart using 5 minute bars, the number of periods for the day is 81 as demonstrated:
6 hours @ 60 minutes = 360 minutes
Total minutes of trading = 360 minutes + 45 minutes = 405 minutes
405 / 5 minute bars = 81 trading periods per day
Now that you have calculated the trading periods per day, you now must calculate the number of periods for the year. Since historical volatility considers every weekday of the year when calculating total periods for the year, the multiplier is 262:
TP = (405)/5) * 262
TP = 81* 262
TP = 21,222
Note: This formula applies only to historical volatility on a variable chart. It does not apply to other chart types.
Now that you have the total number of periods per year, continue with the calculation of the historical volatility.
Calculate the Logarithm of the Price Change for Each Price
Next calculate the logarithm of the price change for each price in the specified time span of n periods. The formula is:
LOGSi = LOG(Pi / Pi-1)
LOG is the logarithm function.
Pi is the current price
Pi-1 is the previous price
Calculate the Total Logarithms for Time Span
Now that you have the logarithms of the price changes, calculate the total logarithms for the time span you are reviewing. To calculate the total of the logarithms, use the following formula:
![]()
Tlogs is the total of the logarithm price ratio for the time span.
S indicates to sum all n logarithms.
LOGSi is the logarithm of the price change for period i.
n is the number of periods for the specified time span.
Calculate the Average of the Logs
The next step is to calculate the average of the logs by dividing the total logarithm by the number of periods as shown below:
ALOGS = Tlogs / n
ALOGS is the average of the logarithms.
Tlogs is the total of the logarithm for the time span.
n is the number of periods for the specified time span.
Sum the Squared Differences
The last calculation is to sum the squares of the difference between the individual logarithms for each period and the average logarithm. This is accomplished in the following formula:
![]()
SSD is the sum of the squared differences.
S indicates to total the squares of all n differences.
LOGSi is the logarithm of the price change for period i.
ALOGS is the average of the logarithms.
Calculate Historial Volatility
Now that the elements of the final formula are complete, the following formula calculates the historical volatility for a given period over a specified time span.
![]()
SSD is the sum of the squared differences.
n is the number of periods for the specified time span.
TP is the total number of trading periods for the year.
Due to the complexity of the formula, it is preferable to use a scientific calculator when attempting to manually calculate the historical volatility of a futures instrument.
Content Source: FutureSource
View Other Technical Analysis Studies
- Bollinger Bands
- Commodity Channel Index
- Crack Spread
- Crush Spread
- Default
- Directional Movement Index
- Envelope
- Exponential Moving Average
- Exponential Oscillator
- High Low Moving Average
- Highest High / Lowest Low
- Historic Volatility
- Keltner Channel
- Least Squares Linear Regression
- Line Oscillator
- Momentum
- Moving Average
- Moving Average Convergence Divergence
- Moving Standard Deviation
- Open Interest
- Oscillator
- Parabolic Stop and Reversal
- Rate of Change
- Relative Strength Index
- Smoothed Moving Average
- Smoothed Oscillator
- Stochastic
- Variable Moving Average
- Volume
- Volume and Open Interest
- Weighted Close
- What is the Slow Stochastic Oscillator?
- Williams’ %R