• Skip to primary navigation
  • Skip to content
  • Skip to primary sidebar
  • Skip to footer
Daniels Trading

Trade Futures, Spreads and Options with Confidence.

Top Navigation

  • Open a Futures Account
  • Sign Up
  • Log in
  • 1.800.800.3840

Primary Navigation Menu

  • About
    • Who We Are
    • Services
    • Risk Disclosure
    • COVID-19
  • Trade
    • Broker-Assisted
    • Self-Directed / Online
    • Request Pricing
  • Hedge
    • Ag Marketing Plan
    • WASDE Analysis
    • Grain Resources
    • Livestock / Dairy Resources
    • Request Pricing
  • Invest
    • Automated Strategies
    • Managed Futures
    • Request Pricing
  • Advisories
    • GENERAL / FUNDAMENTAL
      • DT Newsletter
      • Insider Market Advisory
      • Turner’s Take Newsletter & Podcast
    • TECHNICAL ANALYSIS
      • The Cullen Outlook
      • Data Feed Trade
      • Jarboe Trading Journal
      • Trade Spotlight
    • AG MARKETING
      • Cattleman’s Advisory
      • Technical Ag Knowledge
      • Turner’s Take Ag Marketing
    • THIRD-PARTY RESOURCES
      • CFRN
      • Moore Research Center, Inc. (MRCI)
      • OptionWorks®
      • TASMarketProfile.com
  • Education
    • CME Group Resource Center
    • CME Group Offers
    • Small Exchange Resources
    • Guides
    • Frequently Asked Questions
    • Order Entry Handbook
  • Blog
    • Futures 101
    • Ag Marketing
    • Tips & Strategies
    • Trading Advisories
  • Resources
    • Trading Software
    • Quotes and Charts
    • Futures Calendars
    • Contract Specifications
    • Margin Requirements
    • Futures Calculator
  • Accounts
    • Apply
    • Access My Account
    • Funding
  • Contact
Home / Education / Technical Analysis Learning Center / Default

Default

Each study has its own set of properties which may be modified. Certain studies (such as Bollinger Bands, Exponential Moving Average, and Momentum), perform their calculations using a specific value (Field) from the underlying data on which the study is applied. When the study is initially applied to a chart, it “binds” itself to this Field, which is set in the study properties.

Download our free guide, Futures Trading: Technical Analysis for Beginners,  today!

Rule 1:

The Field “Default” will always be used in a study’s properties, unless you specifically tell the application to use another price field, such as “High”, “Low”, or “Open”.
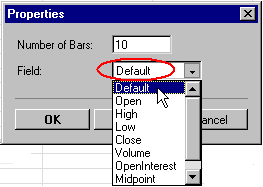
Default Study

Let’s look at an example. The Momentum study is applied to a daily Corn chart. The calculation for Momentum is:

  • MOM = (Value of the current day’s bar) – (Value from 10 days ago)

With Momentum’s properties set to “Default”, the “Value” used in the calculation is the Close Price. However, if Momentum was applied to a daily expression chart (C1! – W1!), the expression does not have a “Close” price. Therefore, the “Value” will be the expression’s result for the specific bar. The study uses the “Default” value available in the underlying price data.

Rule 2:

When a study is applied to a Symbol, “Default” = “Close” (a symbol will always have a “Close” price on which the study can perform its’ calculation). When the study is applied to an expression, “Default” = the expression’s result for the given bar.

When a study is initially applied to a Symbol, the Symbol naturally has data such as “Open”, “High”, “Low”, “Close”, etc. Examination of a study’s properties, when applied to a Symbol, will reveal a drop-down box (as shown in the Properties illustration, above).
technical-analysis-learning-center_default-2

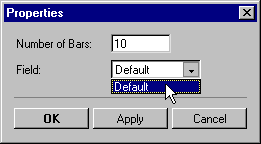
However, when the study is initially applied to an expression, the only data available on which to apply a study is the expression’s result.

Examination of a study’s properties, when applied to an expression, will ONLY reveal the “Default” field as an option:

Rule 3:

A study stays “bound” to the Field on which it was initially calculated.

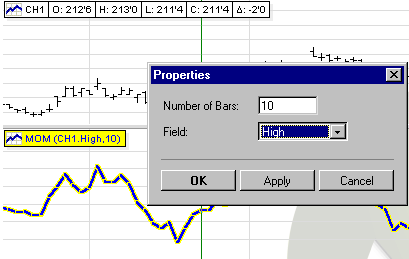
Let’s go back to our original example. You apply the Momentum study to a daily Corn chart. However, you change the study’s properties to calculate Momentum based on the “High” price field. Momentum’s calculation is now “bound” to the “High” price of the underlying data.
technical-analysis-learning-center_default-momentum1

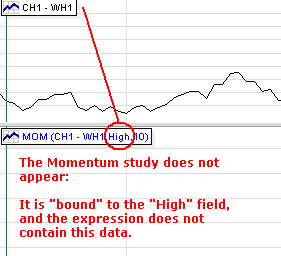
Now, you change the Symbol from Corn to an expression: Nearby Corn – Nearby Wheat. Because Momentum is “bound” to the “High” price of the underlying data (and because an expression does not have a “High” price), the chart cannot show the Momentum study.
technical-analysis-learning-center_default-momentum2

Content Source: FutureSource

Read our guide, Futures Trading: Technical Analysis for Beginners

View Other Technical Analysis Studies

  • Bollinger Bands
  • Commodity Channel Index
  • Crack Spread
  • Crush Spread
  • Directional Movement Index
  • Envelope
  • Exponential Moving Average
  • Exponential Oscillator
  • High Low Moving Average
  • Highest High / Lowest Low
  • Historic Volatility
  • Keltner Channel
  • Least Squares Linear Regression
  • Line Oscillator
  • Momentum
  • Moving Average
  • Moving Average Convergence Divergence
  • Moving Standard Deviation
  • Open Interest
  • Oscillator
  • Parabolic Stop and Reversal
  • Rate of Change
  • Relative Strength Index
  • Slow Stochastic
  • Smoothed Moving Average
  • Smoothed Oscillator
  • Stochastic
  • Variable Moving Average
  • Volume
  • Volume and Open Interest
  • Weighted Close
  • Williams’ %R

Primary Sidebar

Tips & Strategies

Advanced Techniques for Futures Trading: Order Carry Over vs. End of Day Cancellation

Technical Analysis of Stocks: Understand the Pros and Cons

In today’s equities marketplace, the technical analysis of stocks is a popular discipline. Each day, millions of market participants use tools, indicators, and price action as primary decision-making mechanisms. Read on to learn more about the advantages and disadvantages of stock market technical analysis. The Technical Analysis of Stocks Technical analysis is the study of… Read more.

Probabilistic Modeling for Trending Markets

Many mathematicians start with the same, single assumption when they commence any probabilistic modeling: the probability of a market moving higher or lower on any given day is 50%. Though this may seem oversimplified…

Recession

Will the Russia-Ukraine War Cause a U.S. Recession?

The Russian invasion of Ukraine in February 2022 brought dramatic uncertainty to the world’s capital markets. As a result, commodities prices spiked suddenly, led by strong bullish trends in crude oil, gold, and wheat. Can the Russia-Ukraine war prompt a U.S. recession? Read on to learn more about the situation and what to expect for… Read more.

More Tips & Strategies

  • What Is the Best Way to Sell Stock Options?
  • What Are the Four Risks of Trading Stock Options?
  • Understanding the Impact That Stock Option Time Decay Has on Stock Options
  • Bearish and Bullish Options Trading Strategies
  • How High Will Crude Oil Prices Go?
  • Making Money with Stock Options
Trustpilot

Footer

Site Navigation

  • Frequently Asked Questions
  • About Us
  • Customer Reviews
  • Contact Us
  • Futures Blog
  • Open a Futures Trading Account
  • Media Resources
  • Fund Your Account
  • Legal Notices

Contact Us

StoneX Financial Inc.
Daniels Trading Division
230 South LaSalle Suite 10-500
Chicago, IL 60604
+1.312.706.7600 Local / Int'l
+1.800.800.3840 Toll-Free
+1.312.706.7605 Fax

Connect with Us

Trustpilot
Risk Disclosure
  • Risk Disclosure
  • Privacy Policy
  • California Residents Privacy Notice
  • Terms of Use
  • Back to top
 

Loading Comments...
 

You must be logged in to post a comment.