Overview
Pattern evolution:
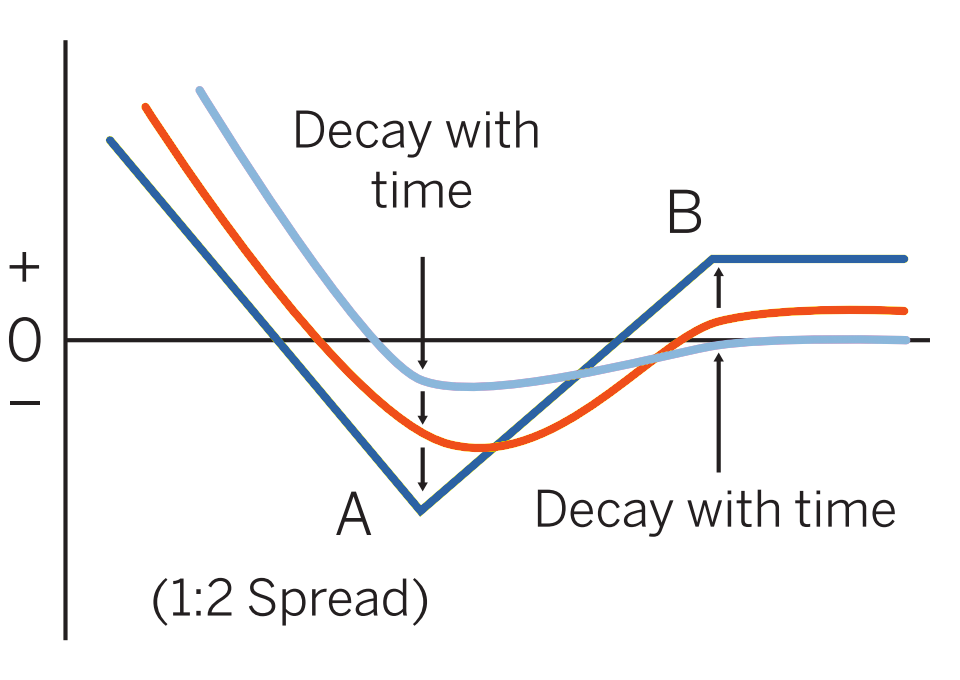
When to use: Normally entered when market is near A and shows signs of increasing activity, with greater probability to downside (for example, if last major move was up, followed by stagnation).
Profit characteristics: Profit limited on upside (to net credit taken in when position was established) but open-ended in collapsing market.
Loss characteristics: Maximum loss, is amount of B – A – initial credit (or B – A + initial debit), realized if market is at A at expiration. This loss is less than for the equivalent long straddle, the trade-off for sacrificing profit potential on the upside.
Decay characteristics: Dependent on the net time value purchased or sold via this strategy. If more time value sold than bought, then time value decays work to the benefit of the holder.
CATEGORY: Precision
Short 1 put B, long 2 or more puts A
Example
Scenario:
The trader is getting very nervous about the stock market. He is sure that the market is overvalued, but not sure when the break will occur. Also, the trader does not want to stand in front of a runaway bull market. This trader is will to NOT participate in upside gains to be certain that the position will be held when the market drops dramatically. He consequently enters into a put ratio backspread.
Specifics:
Underlying Futures Contract: December S&P 500
Futures Price Level: 940
Days to Futures Expiration: 105
Days to Option Expiration: 105
Option Implied Volatility: 16.2%
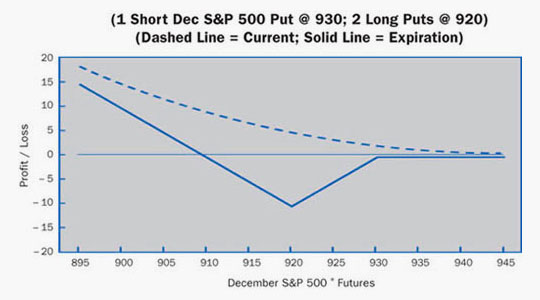
Option Position:
| Short 1 Dec 930 Put | + 7.10 ($1775.00) |
| Long 1 Dec 1.0000 Put | |
| Long 2 Dec 920 Puts | – 4.00 ($1000.00) x 2 |
| – 0.90 ($ 225.00) |
At Expiration:
Breakeven: 909.10 (920.00 strike– 10.00 difference between strikes – 0.90 debit).
Loss Risk: Limited; losses bottom out at strike of long puts. At 920.00 the maximum loss of 10.90 ($2725.00) occurs.
Potential Gain: Unlimited; gains mount as futures fall past 909.10 breakeven.
Things to Watch:
Depending on the exact strikes chosen, a trader could come away with a small gain or loss if futures continued their rally. The worst scenario is to have a mild bear market with volatility dropping.

Additional Futures & Options Strategies
- Long Futures
- Long Synthetic Futures
- Short Synthetic Futures
- Long Risk Reversal
- Short Risk Reversal
- Long Call
- Short Call
- Long Put
- Short Put
- Bear Spread
- Bull Spread
- Long Butterfly
- Short Butterfly
- Long Iron Butterfly
- Short Iron Butterfly
- Long Straddle
- Short Straddle
- Long Strangle
- Short Strangle
- Ratio Call Spread
- Ratio Put Spread
- Ratio Call Backspread
- Box or Conversion
- Futures & Options Strategies Overview
Contents Courtesy of CME Group.