Overview
Pattern evolution:
When to use: One of the few positions which may be entered advantageously in a long-term options series. Enter when, with one month or more to go, cost of the spread is 10 percent or less of B – A (20 percent if a strike exists between A and B). This is a rule of thumb; check theoretical values.
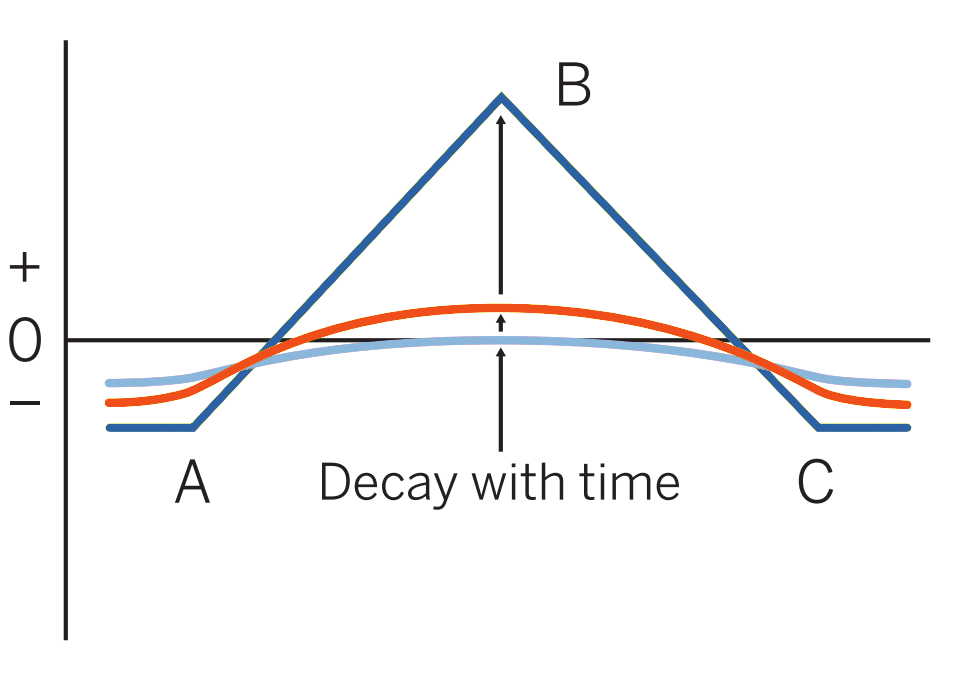
Profit characteristics: Maximum profit occurs if a market is at B at expiration. That profit would be B – A – net cost of spread. This profit develops, almost totally, in the last month.
Loss characteristics: Maximum loss, in either direction, is cost of spread. A very conservative trade, break-evens are at A + cost of spread and at C – cost of spread.
Decay characteristics: Decay negligible until final month, during which distinctive pattern of butterfly forms. Maximum profit growth is at B. If you are away from (A-C) range entering the last month, you may wish to liquidate position.
CATEGORY: Precision
Long call A, short 2 calls B, long call C
Long put A, short 2 puts B, long put C
Example
Scenario:
The trader currently has a #17 Ratio Call Spread. He thinks this is still a good position. However, he is worried that the futures may increase dramatically on the upside, leaving him with a substantial loss. He adds a long call and converts the position into a long butterfly.
Specifics:
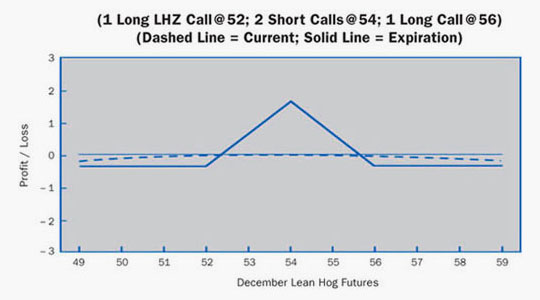
Underlying Futures Contract: December Lean Hogs
Futures Price Level: 52.50
Days to Futures Expiration: 74
Days to Option Expiration: 45
Option Implied Volatility: 21.5%
Option Position:
| Long 1 Dec 52.00 Call | – 1.825 ($547.50) |
| Short 2 Dec 54.00 Calls | + 0.950 ($285.00) X2 |
| Long 1 Dec 56.00 Call | – 0.450 ($135.00) |
| – 0.375 ($112.50) |
At Expiration:
Breakeven: Downside: 52.375 (52.00 strike + 0.375 debit). Upside: 55.625 (56.00 strike – 0.375 debit).
Loss Risk: Losses start above 55.625, or below 52.375, but limited to the debit paid. Maximum loss above 56.00 strike or below 52.00 strike.
Potential Gain: Gains peak at strike of written calls. Maximum profit of 1.625 ($487.50).
Things to Watch:
There is not much risk in this position. Volatility has little effect. Avoid follow-up strategies unless you are quite certain of a particular move. Nearly every follow-up to this strategy requires more than one trade—possibly incurring large transaction costs.

Additional Futures & Options Strategies
- Long Futures
- Long Synthetic Futures
- Short Synthetic Futures
- Long Risk Reversal
- Short Risk Reversal
- Long Call
- Short Call
- Long Put
- Short Put
- Bear Spread
- Bull Spread
- Short Butterfly
- Long Iron Butterfly
- Short Iron Butterfly
- Long Straddle
- Short Straddle
- Long Strangle
- Short Strangle
- Ratio Call Spread
- Ratio Put Spread
- Ratio Call Backspread
- Ratio Put Backspread
- Box or Conversion
- Futures & Options Strategies Overview
Contents Courtesy of CME Group.