
Play Turner’s Take Ag Marketing Podcast Episode 270
Podcast: Play in new window | Download
Subscribe: RSS | Subscribe to Turner's Take Podcast
If you are having trouble listening to the podcast, please click here for Turner’s Take Podcast episodes!
New Podcast
This week we go over our thoughts on the Prospective Plantings report next week and what it could mean for corn and soybean prices. We don’t know what the report will say but we are expecting a lot of volatility if the numbers do not come in as expected. Make sure you take a listen to this week’s Turner’s Take Podcast!
If you are not a subscriber to Turner’s Take Newsletter then text the message TURNER to number 33-777 to try it out for free! You may also click here to register for Turner’s Take.
Prospective Plantings & Quarterly Stocks
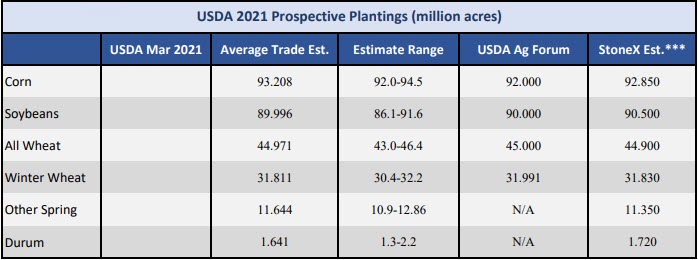
Below are the estimates for next week’s Prospective Plantings and Quarterly Stocks report. A few things jump out at me when looking at the tables below
- 93mm acres corn and 90mm acres soybeans would be a new Corn+Soybean combined acreage total. Given current prices I think these expectations are warranted
- 93mm acres of corn and a trend line yield keeps corn in the $4s and $5s. Only a significant weather scare could send old crop to $6 this summer.
- 90mm acres of soybeans is TIGHT. With a trend line yield we use as much as we produce. Old crop ending stocks are predicted to be 120mm bu. At 90mm acres and a 50.5 bpa my estimates keeps new crop ending stocks at 120mm bu. No changes to ending stocks year-over-year
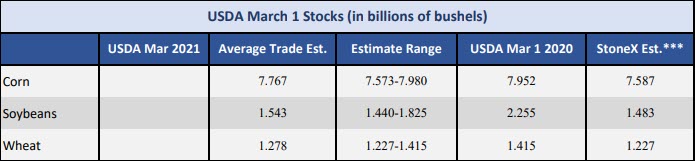
- Corn March 1 stocks estimates are predicted be less than 200mm below last year. In years past we have seen some big misses on the Quarterly Stocks report and it usually has to do with getting the feed number wrong.
- Soybean stocks are going to be much tighter this year than last year at this point in the calendar. Soybeans are very tight.
Interested in working with Craig Turner for hedging and marketing? If so then click here to open an account. If you are a speculative or online trader then please click here.
Corn
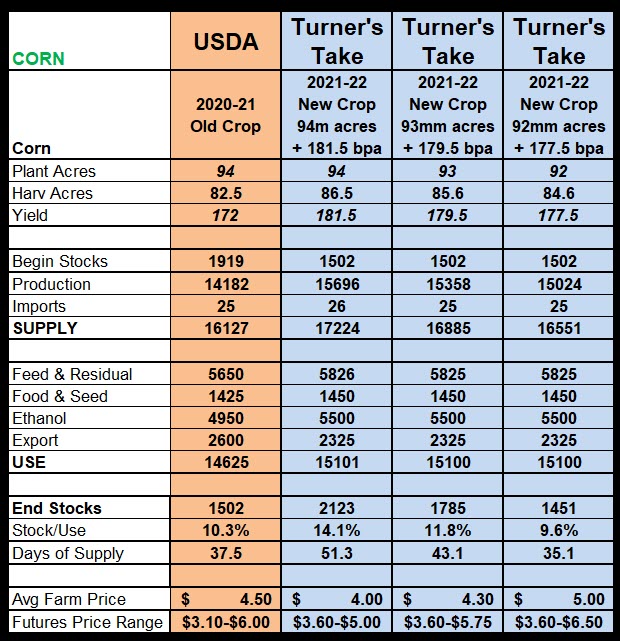
Below are my supply and demand tables for a few different scenarios. For old crop I assume the USDA keeps old crop exports at 2.6 billion. I know many of you think exports could be 200mm to 400mm higher due to Chinese corn demand. I understand the argument but the USDA seems to think the increased buying from China is pushing traditional US corn customers to Ukraine or South America. The opposite happened with soybeans when China moved their business to Brazil and Argentina. The US picked up a lot of export business that used to go to S. America but was pushed out by China.
The middle blue column has or estimates with the industry acreage estimates (93mm) and a trend line yield of 179.5. Stocks are 1.785 billion and that is not tight. Those stock number are adequate and implies new crop eventually trades back down to $4 later this summer when the crop is made.
Keep in mind that a bearish scenario of 94mm acres and a 181.5 yield puts ending stocks back to 2.0 billion and 14% stock/usage ratio. Historically corn trades between $3.60 and $4.30 at those stocks levels. If we are closer to 92mm and a 177.5 bpa ending stocks are 1.4 billion, stock to usage is just under 10%, and corn would be expected to trade in the low to high $4s across the board.
Interested in working with Craig Turner for hedging and marketing? If so then click here to open an account. If you are a speculative or online trader then please click here.
Soybeans
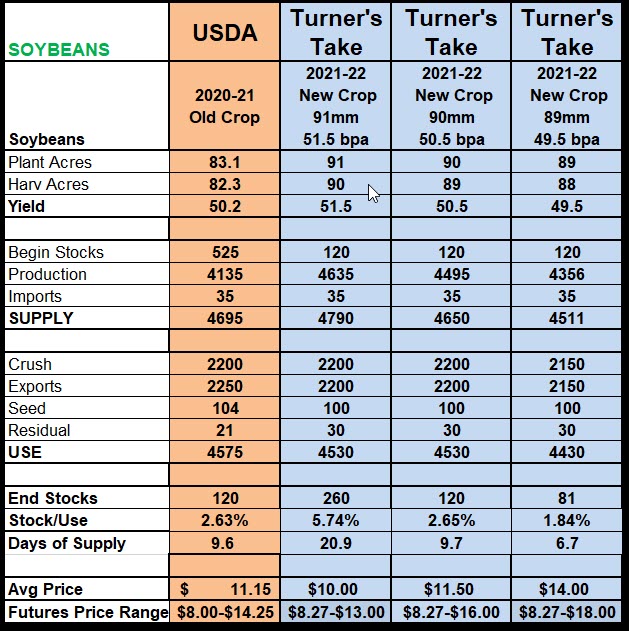
One look at the table below and you’ll see how tight soybeans could get next year. What amazes me is how big the price range can be by just adding/subtracing 1mm acres and 2.5 bpa from expectations. Adding 1mm acres and 1 bpa sends stocks to 260 next year. That is still tight but old crop probably trades around $11 and $12 in that scenario. If we have a 53 yield ending stocks could be north of 400mm bu and soybeans go back to a $9 to $12 trading range.
On the flip side we could be much higher at lightning speed if acres are 1 million less at 89mm and we lose even just 1bpa. Ending stocks would be negative in that situation and to get back to the minimum pipeline exports need to come down 50mm and exports need to come down 50mm. If soybean bpa dropped 2.5 bu to 48 we probably make all time highs this summer. The price ranges in soybeans this spring and summer have the potential to be extreme.
Interested in working with Craig Turner for hedging and marketing? If so then click here to open an account. If you are a speculative or online trader then please click here.
About Turner’s Take Podcast and Newsletter
If you are having trouble listening to the podcast, please click here for Turner’s Take Podcast episodes! Craig Turner – Commodity Futures Broker 312-706-7610 cturner@danielstrading.com Turner’s Take Ag Marketing: https://www.turnerstakeag.com Turner’s Take Spec: https://www.turnerstake.com Twitter: @Turners_Take Contact Craig Turner
Risk Disclosure
The StoneX Group Inc. group of companies provides financial services worldwide through its subsidiaries, including physical commodities, securities, exchange-traded and over-the-counter derivatives, risk management, global payments and foreign exchange products in accordance with applicable law in the jurisdictions where services are provided. References to over-the-counter (“OTC”) products or swaps are made on behalf of StoneX Markets LLC (“SXM”), a member of the National Futures Association (“NFA”) and provisionally registered with the U.S. Commodity Futures Trading Commission (“CFTC”) as a swap dealer. SXM’s products are designed only for individuals or firms who qualify under CFTC rules as an ‘Eligible Contract Participant’ (“ECP”) and who have been accepted as customers of SXM. StoneX Financial Inc. (“SFI”) is a member of FINRA/NFA/SIPC and registered with the MSRB. SFI does business as Daniels Trading/Top Third/Futures Online. SFI is registered with the U.S. Securities and Exchange Commission (“SEC”) as a Broker-Dealer and with the CFTC as a Futures Commission Merchant and Commodity Trading Adviser. References to securities trading are made on behalf of the BD Division of SFI and are intended only for an audience of institutional clients as defined by FINRA Rule 4512(c). References to exchange-traded futures and options are made on behalf of the FCM Division of SFI.
Trading swaps and over-the-counter derivatives, exchange-traded derivatives and options and securities involves substantial risk and is not suitable for all investors. The information herein is not a recommendation to trade nor investment research or an offer to buy or sell any derivative or security. It does not take into account your particular investment objectives, financial situation or needs and does not create a binding obligation on any of the StoneX group of companies to enter into any transaction with you. You are advised to perform an independent investigation of any transaction to determine whether any transaction is suitable for you. No part of this material may be copied, photocopied or duplicated in any form by any means or redistributed without the prior written consent of StoneX Group Inc.
© 2023 StoneX Group Inc. All Rights Reserved
You must be logged in to post a comment.