• Skip to primary navigation
  • Skip to main content
  • Skip to footer
Daniels Trading

Independent. Objective. Reliable.

Top Navigation

  • Open a Futures Account
  • Sign Up
  • Log in
  • 1.800.800.3840

Primary Navigation Menu

  • About
    • Who We Are
    • Services
    • Careers
    • Risk Disclosure
    • COVID-19
  • Trade
    • Broker-Assisted
    • Self-Directed / Online
    • Request Pricing
  • Hedge
    • DanielsAg Mobile App
    • Ag Marketing Plan
    • WASDE Analysis
    • Grain Resources
    • Livestock / Dairy Resources
    • Hedging Videos
    • Request Pricing
  • Invest
    • Automated Strategies
    • Managed Futures
    • Request Pricing
  • Advisories
    • GENERAL / FUNDAMENTAL
      • DT Newsletter
      • Insider Market Advisory
      • Turner’s Take Newsletter & Podcast
    • TECHNICAL ANALYSIS
      • The Cullen Outlook
      • Data Feed Trade
      • Jarboe Trading Journal
      • Trade Spotlight
    • AG MARKETING
      • Cattleman’s Advisory
      • The Swine Times
      • Technical Ag Knowledge
      • This Week in Grain
      • Turner’s Take Ag Marketing
    • THIRD-PARTY RESOURCES
      • CFRN
      • Moore Research Center, Inc. (MRCI)
      • OptionWorks®
      • TASMarketProfile.com
  • Education
    • CME Group Resource Center
    • Small Exchange Resources
    • Guides
    • Frequently Asked Questions
    • Order Entry Handbook
    • Webinars
  • Blog
    • Futures 101
    • Ag Marketing
    • Tips & Strategies
    • Trading Advisories
  • Resources
    • Trading Software
    • Quotes and Charts
    • Futures Calendars
    • Contract Specifications
    • Margin Requirements
    • Futures Calculator
  • Accounts
    • GAIN Capital Futures
    • StoneX
  • Contact
 

What’s the Difference Between Market Structure and Price Action?

December 17, 2020 by Daniels Trading| Futures 101

At first, the concepts of market structure and price action can be a bit confusing. However, if you’re a technical trader or investor, understanding what each term means and how they differ from one another is critical. In this blog, we shed some light on these topics and break down their applications to futures.

What Is Price Action?

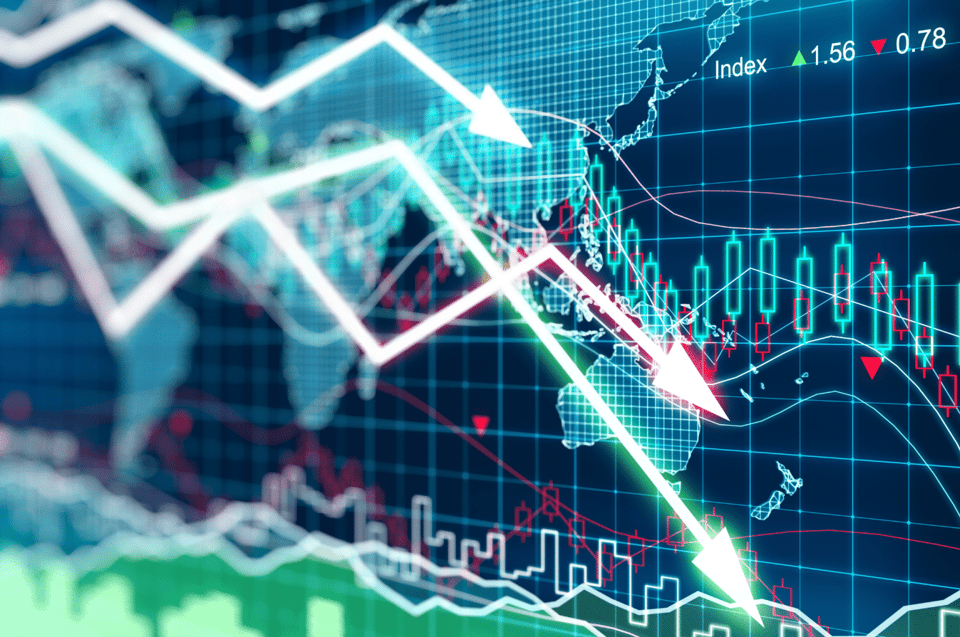
Price action is the fluctuation of a product’s price over a period of time. In an open, publicly traded market, price action represents the changes in a security’s value. It acts as the basis for technical analysis, which is the study of past and present price behavior. For market technicians, price action is the foundation for all trading strategies and methodologies.

Easily create your own custom quote portfolio and custom charts for a more  tailored experience. Visit our Futures Quotes and Charts page today.

To place continuous price action into a manageable context, all variations are charted. Pricing charts are a key part of technical analysis because they translate seemingly random ticks into a user-friendly, visual format. Common chart types are Japanese Candlestick, Open High Low Close (OHLC), and line. When referencing a chart, a trader can quickly ascertain which of the three ways price action may develop:

  • Bullish: Bullish price action refers to an upward move in price. Prices rise when buyers outnumber sellers, thus skewing the bid-ask spread in favor of the bid.
  • Bearish: Bearish price action refers to a downward move in price. Prices fall when sellers outnumber buyers, thus skewing the bid-ask spread in favor of the ask.
  • Neutral: Neutral price action refers to a horizontal move in price. In a neutral scenario, the number of buyers and sellers are roughly equal. The result is muted price action and a balanced bid-ask spread.

The key thing to remember about price action is that it is a product of order flow. As buy and sell orders hit the market, price moves up, down, or sideways in concert with evolving supply and demand. This is an important aspect of the market structure and price action dichotomy―market structure is a product of price action.

What Is Market Structure?

Market structure, also referred to as market state, is a representation of developed price action. Over any given period of time, price action ebbs and flows, moving up, down, or sideways. The result of these fluctuations defines the market’s structure. With pricing charts, it’s easily visible on intraday, daily, weekly, monthly, or yearly time frames.

Technical traders and investors view market state with respect to three basic classifications:

  • Rotation: A market is in rotation when price action is neutral. Rotational markets are defined by reduced trading ranges and overall consolidation. Reversion-to-the-mean trading strategies are typically applied to range-bound or rotational markets.
  • Trend: A market is trending when price action is overtly bullish or bearish. Trend trading is a popular methodology because realizing extraordinary profits is possible. Buying or selling pullbacks from Fibonacci levels are common ways of trading trending markets.
  • Reversal: A market is under reversal when price action has changed directions. Spotting reversals can be challenging but lucrative, if successful. Identifying trend exhaustion points with momentum oscillators or chart patterns are two ways of trading reversals.

By identifying chart patterns or using technical indicators and tools, traders are able to ascertain a market’s structure. Once this step is accomplished, a trader can apply an appropriate strategy to that market. In this way, the evaluation of market structure and price action may become an integral part of selecting positive-expectation trading opportunities in real time.

Market Structure and Price Action: What’s the Difference?

Remember, the difference between market structure and price action is this: Price action is the basis for market structure. A security’s price is always moving and contributing to that security’s periodic market state. If you can accurately identify market state, then you can choose a trading strategy that’s more likely to generate profit.

In this blog, we’ve talked at length about price. A great tool for staying on top of price movements is Daniels Trading’s Futures Quotes and Charts portal. Featuring market-direct quotes and charts, the portal enables you to monitor all significant developments in the futures markets, from grains to financials.

Daniels Trading Futures Quotes and Charts

Filed Under: Futures 101

About Daniels Trading

Daniels Trading is an independent futures brokerage firm located in the heart of Chicago’s financial district. Established by renowned commodity trader Andy Daniels in 1995, Daniels Trading is built on a culture of trust committed to the firm’s mission of Independence, Objectivity and Reliability.

Risk Disclosure

THIS MATERIAL IS CONVEYED AS A SOLICITATION FOR ENTERING INTO A DERIVATIVES TRANSACTION.

THIS MATERIAL HAS BEEN PREPARED BY A DANIELS TRADING BROKER WHO PROVIDES RESEARCH MARKET COMMENTARY AND TRADE RECOMMENDATIONS AS PART OF HIS OR HER SOLICITATION FOR ACCOUNTS AND SOLICITATION FOR TRADES; HOWEVER, DANIELS TRADING DOES NOT MAINTAIN A RESEARCH DEPARTMENT AS DEFINED IN CFTC RULE 1.71. DANIELS TRADING, ITS PRINCIPALS, BROKERS AND EMPLOYEES MAY TRADE IN DERIVATIVES FOR THEIR OWN ACCOUNTS OR FOR THE ACCOUNTS OF OTHERS. DUE TO VARIOUS FACTORS (SUCH AS RISK TOLERANCE, MARGIN REQUIREMENTS, TRADING OBJECTIVES, SHORT TERM VS. LONG TERM STRATEGIES, TECHNICAL VS. FUNDAMENTAL MARKET ANALYSIS, AND OTHER FACTORS) SUCH TRADING MAY RESULT IN THE INITIATION OR LIQUIDATION OF POSITIONS THAT ARE DIFFERENT FROM OR CONTRARY TO THE OPINIONS AND RECOMMENDATIONS CONTAINED THEREIN.

PAST PERFORMANCE IS NOT NECESSARILY INDICATIVE OF FUTURE PERFORMANCE. THE RISK OF LOSS IN TRADING FUTURES CONTRACTS OR COMMODITY OPTIONS CAN BE SUBSTANTIAL, AND THEREFORE INVESTORS SHOULD UNDERSTAND THE RISKS INVOLVED IN TAKING LEVERAGED POSITIONS AND MUST ASSUME RESPONSIBILITY FOR THE RISKS ASSOCIATED WITH SUCH INVESTMENTS AND FOR THEIR RESULTS.

TRADE RECOMMENDATIONS AND PROFIT/LOSS CALCULATIONS MAY NOT INCLUDE COMMISSIONS AND FEES. PLEASE CONSULT YOUR BROKER FOR DETAILS BASED ON YOUR TRADING ARRANGEMENT AND COMMISSION SETUP.

YOU SHOULD CAREFULLY CONSIDER WHETHER SUCH TRADING IS SUITABLE FOR YOU IN LIGHT OF YOUR CIRCUMSTANCES AND FINANCIAL RESOURCES. YOU SHOULD READ THE "RISK DISCLOSURE" WEBPAGE ACCESSED AT WWW.DANIELSTRADING.COM AT THE BOTTOM OF THE HOMEPAGE. DANIELS TRADING IS NOT AFFILIATED WITH NOR DOES IT ENDORSE ANY TRADING SYSTEM, NEWSLETTER OR OTHER SIMILAR SERVICE. DANIELS TRADING DOES NOT GUARANTEE OR VERIFY ANY PERFORMANCE CLAIMS MADE BY SUCH SYSTEMS OR SERVICE.

GLOBAL ASSET ADVISORS, LLC (“GAA”) (DBA: DANIELS TRADING, TOP THIRD AG MARKETING AND FUTURES ONLINE) IS AN INTRODUCING BROKER TO GAIN CAPITAL GROUP, LLC (GCG) A FUTURES COMMISSION MERCHANT AND RETAIL FOREIGN EXCHANGE DEALER. GAA AND GCG ARE WHOLLY OWNED SUBSIDIARIES OF STONEX GROUP INC. (NASDAQ:SNEX) THE ULTIMATE PARENT COMPANY.

Subscribe To The Blog

Footer

Site Navigation

  • Frequently Asked Questions
  • About Us
  • Customer Reviews
  • Contact Us
  • Futures Blog
  • Open a Futures Trading Account
  • Media Resources
  • Fund Your Account
  • Legal Notices

Contact Us

Daniels Trading
100 South Wacker Drive, Suite 1225
Chicago, IL 60606
+1.312.706.7600 Local / Int'l
+1.800.800.3840 Toll-Free
+1.312.706.7605 Fax

Connect with Us

Trustpilot

Copyright © 2021 · Daniels Trading. All rights reserved.

Risk Disclosure

THIS MATERIAL IS CONVEYED AS A SOLICITATION FOR ENTERING INTO A DERIVATIVES TRANSACTION.

THIS MATERIAL HAS BEEN PREPARED BY A DANIELS TRADING BROKER WHO PROVIDES RESEARCH MARKET COMMENTARY AND TRADE RECOMMENDATIONS AS PART OF HIS OR HER SOLICITATION FOR ACCOUNTS AND SOLICITATION FOR TRADES; HOWEVER, DANIELS TRADING DOES NOT MAINTAIN A RESEARCH DEPARTMENT AS DEFINED IN CFTC RULE 1.71. DANIELS TRADING, ITS PRINCIPALS, BROKERS AND EMPLOYEES MAY TRADE IN DERIVATIVES FOR THEIR OWN ACCOUNTS OR FOR THE ACCOUNTS OF OTHERS. DUE TO VARIOUS FACTORS (SUCH AS RISK TOLERANCE, MARGIN REQUIREMENTS, TRADING OBJECTIVES, SHORT TERM VS. LONG TERM STRATEGIES, TECHNICAL VS. FUNDAMENTAL MARKET ANALYSIS, AND OTHER FACTORS) SUCH TRADING MAY RESULT IN THE INITIATION OR LIQUIDATION OF POSITIONS THAT ARE DIFFERENT FROM OR CONTRARY TO THE OPINIONS AND RECOMMENDATIONS CONTAINED THEREIN.

PAST PERFORMANCE IS NOT NECESSARILY INDICATIVE OF FUTURE PERFORMANCE. THE RISK OF LOSS IN TRADING FUTURES CONTRACTS OR COMMODITY OPTIONS CAN BE SUBSTANTIAL, AND THEREFORE INVESTORS SHOULD UNDERSTAND THE RISKS INVOLVED IN TAKING LEVERAGED POSITIONS AND MUST ASSUME RESPONSIBILITY FOR THE RISKS ASSOCIATED WITH SUCH INVESTMENTS AND FOR THEIR RESULTS.

TRADE RECOMMENDATIONS AND PROFIT/LOSS CALCULATIONS MAY NOT INCLUDE COMMISSIONS AND FEES. PLEASE CONSULT YOUR BROKER FOR DETAILS BASED ON YOUR TRADING ARRANGEMENT AND COMMISSION SETUP.

YOU SHOULD CAREFULLY CONSIDER WHETHER SUCH TRADING IS SUITABLE FOR YOU IN LIGHT OF YOUR CIRCUMSTANCES AND FINANCIAL RESOURCES. YOU SHOULD READ THE "RISK DISCLOSURE" WEBPAGE ACCESSED AT WWW.DANIELSTRADING.COM AT THE BOTTOM OF THE HOMEPAGE. DANIELS TRADING IS NOT AFFILIATED WITH NOR DOES IT ENDORSE ANY TRADING SYSTEM, NEWSLETTER OR OTHER SIMILAR SERVICE. DANIELS TRADING DOES NOT GUARANTEE OR VERIFY ANY PERFORMANCE CLAIMS MADE BY SUCH SYSTEMS OR SERVICE.

GLOBAL ASSET ADVISORS, LLC (“GAA”) (DBA: DANIELS TRADING, TOP THIRD AG MARKETING AND FUTURES ONLINE) IS AN INTRODUCING BROKER TO GAIN CAPITAL GROUP, LLC (GCG) A FUTURES COMMISSION MERCHANT AND RETAIL FOREIGN EXCHANGE DEALER. GAA AND GCG ARE WHOLLY OWNED SUBSIDIARIES OF STONEX GROUP INC. (NASDAQ:SNEX) THE ULTIMATE PARENT COMPANY.

  • Risk Disclosure
  • Privacy Policy
  • California Residents Privacy Notice
  • Terms of Use
  • Back to top