The Moving Average Ribbon indicator is a series of moving averages of different lengths plotted at the same time on a chart. The result is a ribbon appearance that gives a 3 dimensional look.
The ribbon is made up of 8 different length moving averages. In this indicator, an exponential moving average is used. The shortest moving average is called the base length. This is an input that can be set in the properties of the indicator. By default, it is set at 10. The rest of the averages are based off of the increment property, which is also defaulted to 10. The increment is the amount added to each average. For example, the second line is set to a 20 period, the third line is set to 30 and so on. Changing either the base or the increment will allow you to adjust the sensitivity of the indicator. Smaller numbers are more reactive to price movement and larger numbers are slower acting or smoother.
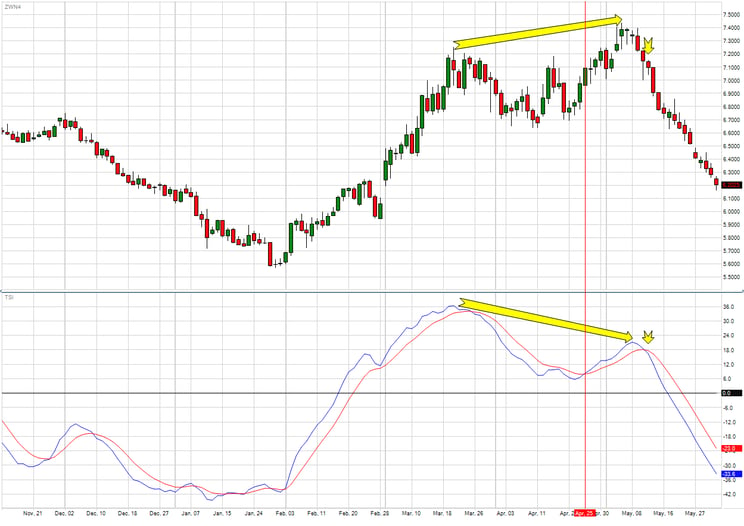
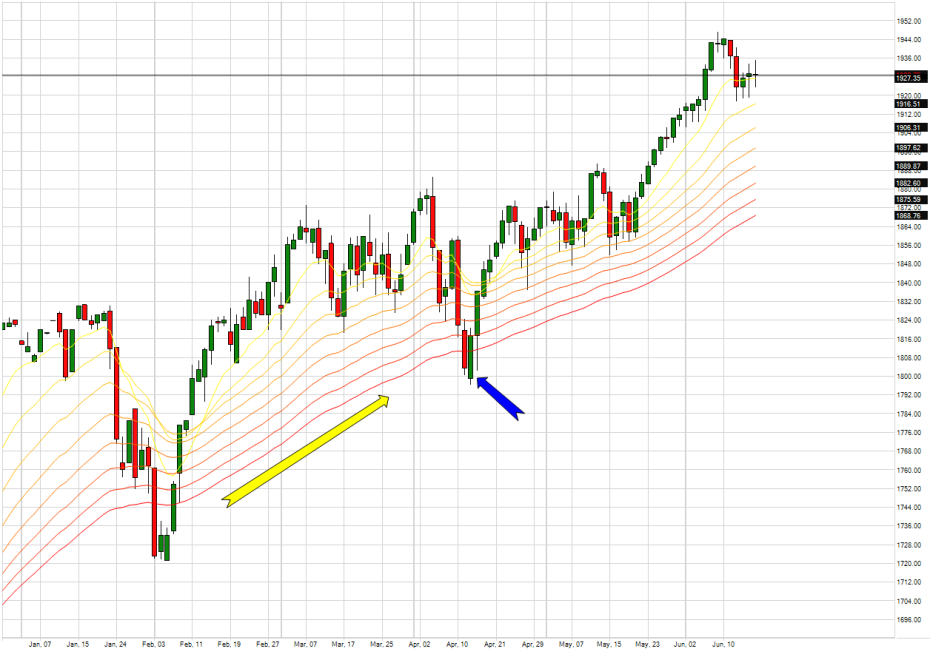
Traditional interpretation looks for all the averages to be moving in the same direction to determine that a trend is strong.
Positions are entered or added on to when the bars pull back or retrace to the lower moving averages as the blue arrow indicates in the image above. While this is a very basic interpretation, I choose to use a different approach in the interpretation of the Moving Average Ribbon indicator. I already have plenty of indicators that measure trends or tell me if a market is in a trend.
I like to look for the ribbon to consolidate and collapse on itself. These indicate a period of inflection and often a breakout point.
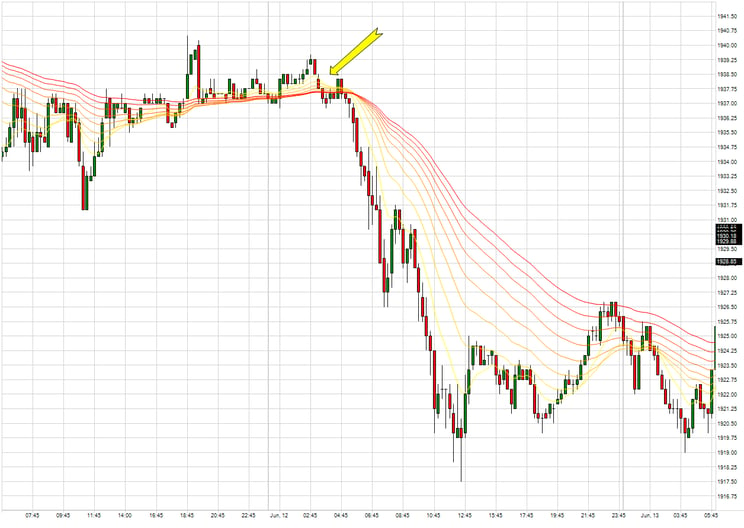
The yellow arrow shows where the ribbon collapses. In my opinion, a potential way to take advantage of a possible move is to place a bracket order above and below the current price channel.
The time frame this indicator is applied to will determine the type of strategy to use. On intraday charts, I would suggest sticking to trading the underlying instrument. However, if it is applied to a daily chart and you see the ribbon collapse, options can be a way to trade as well. Employing an options straddle strategy can possibly take advantage of a new trend after the ribbon collapses.
As with all indicators, there are many ways to interpret them and use them to determine proper strategies. You have to find what works for you.
This indicator is available in the Indicator Store through your dt Pro platform. If you have any problems with installing the indicator or its usage, please feel free to contact me at 312-706-7662 or email at mdunbar@danielstrading.com.
Risk Disclosure
WHEN INVESTING IN THE PURCHASING OF OPTIONS, YOU MAY LOSE ALL OF THE MONEY YOU INVESTED.
WHEN SELLING OPTIONS, YOU MAY LOSE MORE THAN THE FUNDS YOU INVESTED.
STRATEGIES USING COMBINATIONS OF POSITIONS, SUCH AS SPREAD AND STRADDLE POSITIONS MAY BE AS RISKY AS TAKING A SIMPLE LONG OR SHORT POSITION.
The StoneX Group Inc. group of companies provides financial services worldwide through its subsidiaries, including physical commodities, securities, exchange-traded and over-the-counter derivatives, risk management, global payments and foreign exchange products in accordance with applicable law in the jurisdictions where services are provided. References to over-the-counter (“OTC”) products or swaps are made on behalf of StoneX Markets LLC (“SXM”), a member of the National Futures Association (“NFA”) and provisionally registered with the U.S. Commodity Futures Trading Commission (“CFTC”) as a swap dealer. SXM’s products are designed only for individuals or firms who qualify under CFTC rules as an ‘Eligible Contract Participant’ (“ECP”) and who have been accepted as customers of SXM. StoneX Financial Inc. (“SFI”) is a member of FINRA/NFA/SIPC and registered with the MSRB. SFI does business as Daniels Trading/Top Third/Futures Online. SFI is registered with the U.S. Securities and Exchange Commission (“SEC”) as a Broker-Dealer and with the CFTC as a Futures Commission Merchant and Commodity Trading Adviser. References to securities trading are made on behalf of the BD Division of SFI and are intended only for an audience of institutional clients as defined by FINRA Rule 4512(c). References to exchange-traded futures and options are made on behalf of the FCM Division of SFI.
Trading swaps and over-the-counter derivatives, exchange-traded derivatives and options and securities involves substantial risk and is not suitable for all investors. The information herein is not a recommendation to trade nor investment research or an offer to buy or sell any derivative or security. It does not take into account your particular investment objectives, financial situation or needs and does not create a binding obligation on any of the StoneX group of companies to enter into any transaction with you. You are advised to perform an independent investigation of any transaction to determine whether any transaction is suitable for you. No part of this material may be copied, photocopied or duplicated in any form by any means or redistributed without the prior written consent of StoneX Group Inc.
© 2023 StoneX Group Inc. All Rights Reserved
You must be logged in to post a comment.