The True Strength Index is an indicator that was developed by William Blau in the early 1990’s. It is a momentum-based indicator that was designed to show both trend and over-bought/over-sold conditions. If you would like more information on William Blau’s work, I suggest reading his book “Momentum, Direction and Divergence”, Wiley & Sons 1995.
Momentum is the difference in price between the current price and x prices ago. It can be a very choppy indicator and is difficult to interpret, so most people try and smooth the choppiness with moving averages. The TSI is no exception.
Calculate True Strength Index (TSI)
To calculate the TSI, first take the difference between the current bar’s closing price and the previous bar’s closing price. This difference is commonly called Momentum. Then take a 25 bar exponential average of the momentum calculation. Apply a second 13 bar exponential average to the first exponential average. This is called double smoothing as you are taking two averages of the initial calculation. A second double smoothing calculation is applied to the absolute value of momentum with the same 25 and 13 exponential averages. The first double smooth of momentum is divided by the second double smooth of the absolute value of momentum. The result is then multiplied by 100 to give us a potential range of +100 to -100. This is the TSI line and a final 7 period exponential average is taken of the TSI to give us the signal line.
Any trades are educational examples only. They do not include commissions and fees.
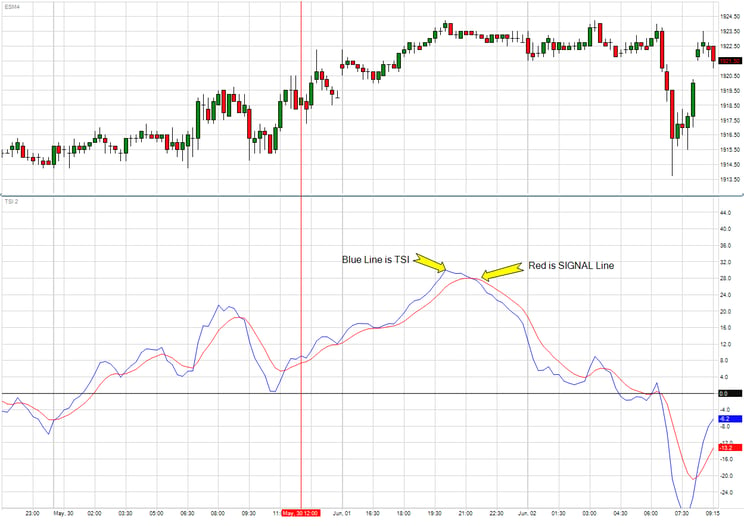
The chart above shows the indicator applied to a chart with the TSI and Signal line. I also have the indicator plot a zero line so I can better see when it is positive or negative.
Interpreting TSI
I have previously mentioned there is an entire book on the use of this indicator and its many interpretations. I’m going to show you one way I use this indicator to time entries into the market.
I like to use divergence with the TSI and Price. If you take a look at the blue arrow on the chart below, you can see that price made a higher high. At the same time, the TSI did not and the Red arrow shows the lower high made at the same time. This is divergence – where one item goes in one direction and the other item goes the opposite way. This divergence is the setup indicating that even though price was increasing, it was doing so with less strength.
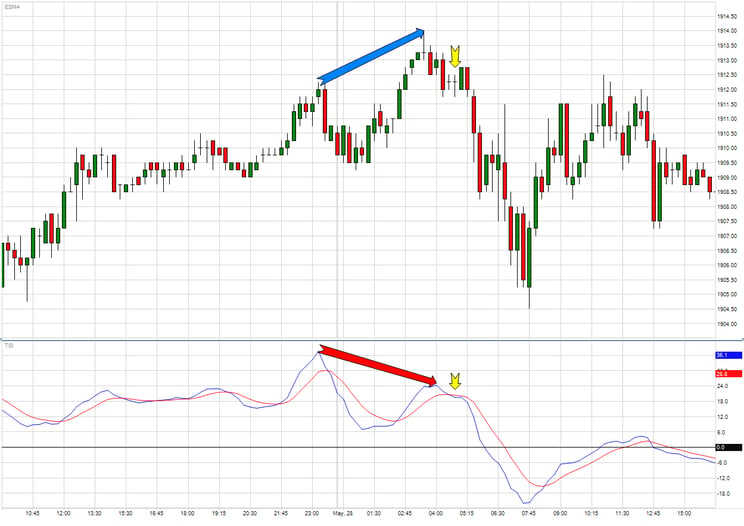
The actual entry comes from the cross of the signal line, which I marked with the yellow arrow. I marked the same bar on the price data so you can see where you could have sold the market. The market has a nice sell off after which you could have potentially captured.
While this chart is based on 15 minutes, the indicator is fractal. This means it can be applied to any time frame with the same expectation in interpretation.
Any trades are educational examples only. They do not include commissions and fees.
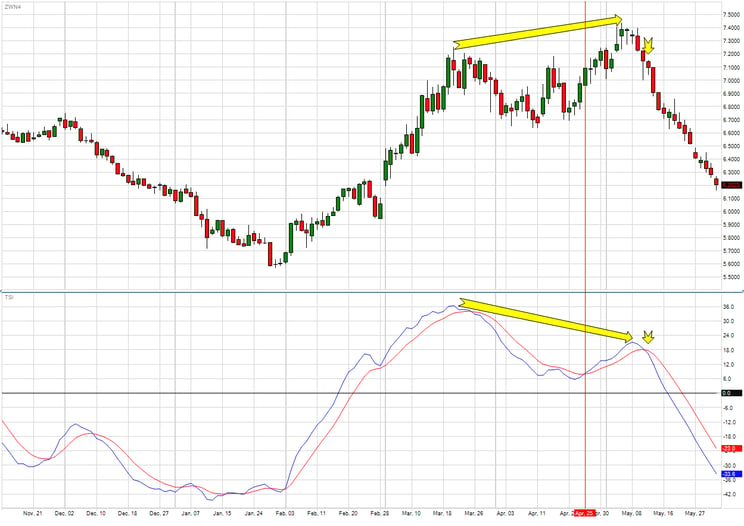
Look at the divergence in price and the TSI seen on the daily chart of Wheat above. You can see the bar I marked as the signal lined crossed, which indicated a potential sell signal and the market moved lower.
As with any indicator, having confirmation from other indicators is always better. On the daily charts, I like to look at Seasonals and use the TSI as a confirmation and entry trigger for the trades. On intraday charts, you can have confirmations with indicators that measure over-bought/oversold conditions.


