Over the last century, traders and technicians have studied the markets looking for patterns that will help them better forecast the market’s next move. Over time, traders have found chart patterns and formations that have proven to be relevant across a variety of markets. Trading neophytes are now able to rely on this research to feel more comfortable with their trading decisions. This article will focus on symmetrical triangles, ascending triangles, and descending triangle formations. It is important to note that unexpected news and events can easily alter these formations and can cause the market to change course, however, these formations are important for traders to understand.
Symmetrical triangles form during periods of indecision. This indecision causes the market to make lower highs and higher lows as time progresses. As the trading range narrows, the chart begins to look like a sideways triangle or pennant. The tug of war between buyers and sellers will eventually resolve itself and the market will break outside of the triangle. Symmetrical triangles are normally thought of as continuation patterns, meaning the market will take some time to consolidate before resuming its longer term trend. Traders will look for triangles as possible new entries in trending markets. In bullish markets, traders will consider buying at the bottom of the triangle, or buying on a close above the upper trend line for a breakout. In bearish markets, traders will do the opposite.
As previously mentioned, the first thing to keep in mind is the longer term trend in the market. By looking at the gold market, we notice that the longer term trend is bullish. Gold has consolidated and we notice a symmetrical triangle has formed.
Any trades are educational examples only. They do not include commissions and fees.
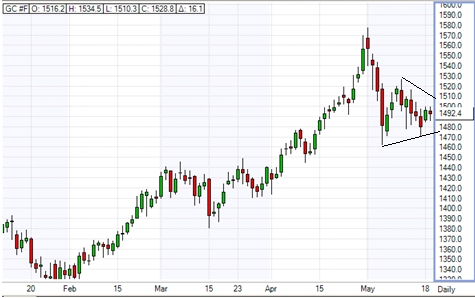
Gold Chart 1
As we fast forward in time, we notice that gold has bounced off the bottom line of the triangle and has pushed all the way through the top of the triangle.
The next formation we will look at is known as an ascending triangle. Ascending triangles are considered to be bullish formations and are most commonly used in markets that are in an uptrend. Ascending triangle will have flat tops and the bottom trend line will be angled higher. The flat top of the triangle is formed when a market tests a resistance level, fails, and falls back down. The market will then re-test the previous high, fail, and then fall back down. In an ascending triangle, the market will make higher lows on each pull back and will form a slanted lower trend line pointing higher.
Below you will see a chart of November Soybeans. The market has failed on several occasions around the 1400 price level and retreated lower. These attempts to move above 1400 form the flat top of the triangle. Every time Soybeans failed to break 1400, the market made higher lows. These higher lows are what form the bottom trend line to complete the ascending triangle.
Any trades are educational examples only. They do not include commissions and fees.
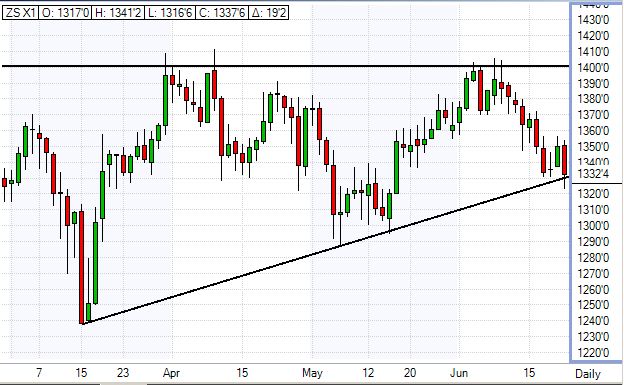
Soybeans Chart
Buyers will view the lower trend line as a level of support and could buy when the market pulls back to those levels, or they could wait for a close outside of the top of the triangle before going long the market.
Flat bottom triangles, or descending triangles are the reverse of the ascending triangle. These are viewed as bearish price formations and will have a flat bottom. The market will selloff down to a certain price level, find support, and move higher. The market will then sell back off to re-test the same support line forming a flat bottom. The upper trend line will see lower highs off of each bounce from the bottom support line. These lower highs will form a downward pointing trend line to complete the triangle.
Sellers will wait for the market to bounce off of the flat bottom and reach the upper trend line before selling, or they will wait for a close below the bottom support line to signal going short.
Triangle patterns are just a few of the formations traders will consider when analyzing the market.
