• Skip to primary navigation
  • Skip to content
  • Skip to primary sidebar
  • Skip to footer
StoneX®

Trade Futures, Spreads and Options with Confidence.

Top Navigation

  • Open a Futures Account
  • Sign Up
  • Log in
  • 1.800.800.3840

Primary Navigation Menu

  • About
    • Who We Are
    • Services
    • Risk Disclosure
    • COVID-19
  • Trade
    • Broker-Assisted
    • Self-Directed / Online
    • Request Pricing
  • Hedge
    • Ag Marketing Plan
    • WASDE Analysis
    • Grain Resources
    • Livestock / Dairy Resources
    • Request Pricing
  • Invest
    • Automated Strategies
    • Managed Futures
    • Request Pricing
  • Advisories
    • GENERAL / FUNDAMENTAL
      • DT Newsletter
      • Insider Market Advisory
      • Turner’s Take Newsletter & Podcast
    • TECHNICAL ANALYSIS
      • The Cullen Outlook
      • Data Feed Trade
      • Jarboe Trading Journal
      • Trade Spotlight
    • AG MARKETING
      • Cattleman’s Advisory
      • Technical Ag Knowledge
      • Turner’s Take Ag Marketing
    • THIRD-PARTY RESOURCES
      • CFRN
      • Moore Research Center, Inc. (MRCI)
      • OptionWorks®
      • TASMarketProfile.com
  • Education
    • CME Group Resource Center
    • CME Group Offers
    • Small Exchange Resources
    • Guides
    • Frequently Asked Questions
    • Order Entry Handbook
  • Blog
    • Futures 101
    • Ag Marketing
    • Tips & Strategies
    • Trading Advisories
  • Resources
    • Trading Software
    • Quotes and Charts
    • Futures Calendars
    • Contract Specifications
    • Margin Requirements
    • Futures Calculator
  • Accounts
    • Apply
    • Access My Account
    • Funding
  • Contact
Home / Futures Blog / Using Dojis for Short Term Trading

Using Dojis for Short Term Trading

July 12, 2011 by Scott Hoffman

This article was originally written by Scott Hoffman on May 12, 2006.

Doji bars are one of the single most useful single bar patterns that any trader can identify. They can be used for entries, exits, or to determine position bias. “Doji” is a term used by Japanese candlestick chartists that refer to a bar where the open and close of a bar are in close approximation to each other. They do not have to be exactly the same, but they should be very close. For our purposes, we use the definition where the open and close are within 25% of the days trading range of each other. It doesn’t matter if the “Doji” occurs near the top, middle, or bottom of the days trading range, only that they are close. For example, if the days range (high to low) is 10 cents, then the open and close would need to be within 2 ½ cents of each other to qualify as a Doji.

The underlying theory of the Japanese Candlestick approach:

  1. The “what” a market is doing (price action) is more important than the “why” (news, market reports, and so on).
  2. All information known to the public is reflected in the current price.
  3. Buyers and sellers move markets based on expectations and emotions (fear and greed).
  4. Markets fluctuate and oscillate.
  5. The actual current price may not reflect the real underlying value.

But more importantly, what most Doji bars represent is indecision in the market place, a place in the market where neither buyers or sellers have an advantage over each other, nor are willing to commit to the market, and are at an impasse.

Position, Swing and Day Traders:

  1. For longer-term traders, dojis are often found at turning points where trends reverse, and they are almost always found in patterns of consolidation where it is indeterminate whether a trend will continue or reverse.
  2. For day traders, dojis can act as the catalyst for signal set-up bars that may indicate potential trend days.

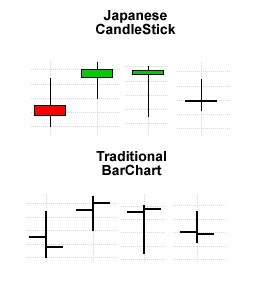
Although the term doji refers to Japanese candlestick charts, you do not actually need to look at a Candlestick chart to recognize dojis; in fact, they can be easily recognized on conventional bar charts. There is one significant difference between candlesticks and the conventional bar chart. Candlesticks tend to highlight the Open-to-Close relationships where as traditional bar charts tend to highlight a Close-to-Close relationship. With a little practice, Doji bars are easily identifiable when looking at a traditional bar chart. In the illustrations you will be looking at, a red “body” will highlight a “Down” bar (where the close is below the open), and Green will highlight an “Up” bar (where the close is higher than the open). Standard black will be used for the traditional bar charts.

Please click to view the Risk of Loss risk disclosure below.

Here is an example of Doji bars plotted both ways-Japanese candlestick style versus the traditional bar chart method.

Japanese Candle Stick

Now let’s take a look at a few examples with both Japanese candlesticks and the traditional bar chart together and discuss how to practically incorporate the “Doji” bars into our trading approach. The featured market here will be Soybeans. There are several points of interest in Chart #1.

Chart 1

Doji Chart 1

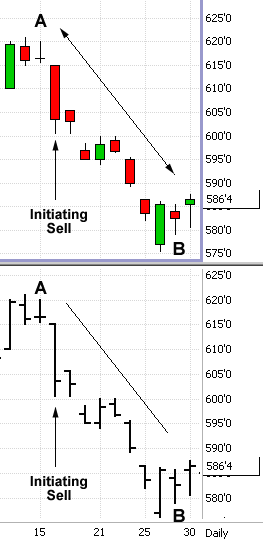
First, the obvious point is that Doji bars occurred at both ends of the downtrend, beginning at point “A” and ending at point “B”. The second, and most important, point is that even though Doji bars occur at both ends of this short trend, they did not forecast the trend or the reversal. What they did do was provide the “Heads-Up” that the previous price action in the market was changing and the market might merit a trader’s attention. One of the largest problems a speculator faces is learning “where” to focus his or her attention and funds. Learning to identify and trade Doji bars can help make these decisions.

Note that while the Doji at point “A” gave the heads up, the trend was not initiated until the bar labeled “Initiating Sell” was established. After the short downtrend, notice that at point “B” we see 2 Doji bars back-to-back. At this time there is no way to know whether the trend is pausing before resuming the move lower or whether the trend will reverse.

In most successful trades there is a point when markets are cooperating and the trader feels secure with his or her position, then at some point the picture becomes “muddled” and uncertain. Learning to identify and properly react to Doji bars can help a trader deal with this period of uncertainty.

Now let’s see what happens next in Chart # 2.

Chart 2

Doji Chart 2

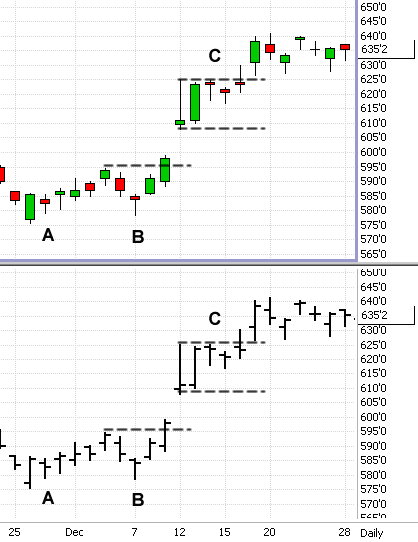
Here we pick up where we left off in the first example. As you can see at point “A” there was a moderate rally after the previous downtrend. Although the market moved higher, this is hardly what could be called a reversal. Again we would like to emphasize that a Doji bar is not predictive of future price direction, only that the previous environment has changed. Market bias, entry/exit signals, and positions should still be determined by additional analysis.

At point “B” we can see another “Doji” bar on the 2-day break from the recent high. It might be appropriate to expect a move to the upside but it would only be a suspicion. The potential trend reversal was not complete until new highs were made, in particular a close above the previous swing high marked by the dotted horizontal line.

Moving forward, we can see that the area marked by point “C” begins a consolidation phase that last for 5 days. It is important to note that in this case the Doji bar(s) did not result in a trend reversal but rather defined a trading range and a period of consolidation before the trend resumed the move to the upside.

Markets are in a constant state of flux going from trending to consolidation to trending again, either by reversing or continuing the previous trend. Learning to identify, understand, and react to Doji bars can help a trader identify where a market is in the cycle and trade accordingly.

© 2011 Scott Hoffman

.

Risk Disclosure

The StoneX Group Inc. group of companies provides financial services worldwide through its subsidiaries, including physical commodities, securities, exchange-traded and over-the-counter derivatives, risk management, global payments and foreign exchange products in accordance with applicable law in the jurisdictions where services are provided. References to over-the-counter (“OTC”) products or swaps are made on behalf of StoneX Markets LLC (“SXM”), a member of the National Futures Association (“NFA”) and provisionally registered with the U.S. Commodity Futures Trading Commission (“CFTC”) as a swap dealer. SXM’s products are designed only for individuals or firms who qualify under CFTC rules as an ‘Eligible Contract Participant’ (“ECP”) and who have been accepted as customers of SXM. StoneX Financial Inc. (“SFI”) is a member of FINRA/NFA/SIPC and registered with the MSRB. SFI does business as Daniels Trading/Top Third/Futures Online. SFI is registered with the U.S. Securities and Exchange Commission (“SEC”) as a Broker-Dealer and with the CFTC as a Futures Commission Merchant and Commodity Trading Adviser. References to securities trading are made on behalf of the BD Division of SFI and are intended only for an audience of institutional clients as defined by FINRA Rule 4512(c). References to exchange-traded futures and options are made on behalf of the FCM Division of SFI.

Trading swaps and over-the-counter derivatives, exchange-traded derivatives and options and securities involves substantial risk and is not suitable for all investors. The information herein is not a recommendation to trade nor investment research or an offer to buy or sell any derivative or security. It does not take into account your particular investment objectives, financial situation or needs and does not create a binding obligation on any of the StoneX group of companies to enter into any transaction with you. You are advised to perform an independent investigation of any transaction to determine whether any transaction is suitable for you. No part of this material may be copied, photocopied or duplicated in any form by any means or redistributed without the prior written consent of StoneX Group Inc.

© 2023 StoneX Group Inc. All Rights Reserved

Filed Under: Swing Trader's Insight, Trade or Fade

About Scott Hoffman

Scott graduated from the University of Chicago in 1986 with a degree in Economics. After graduation, Scott worked on the floor of the Chicago Mercantile Exchange then moved upstairs, serving as the personal broker to a former chairman of the Chicago Board of Trade. There, he worked as a broker and margin manager, starting up the firm’s full service brokerage division.

Today, Scott serves as an educator and mentor for new traders, and as a trading partner and ally for experienced traders. The breadth and depth of Scott’s knowledge make him the “go to guy” for both retail and institutional traders.

Scott also publishes two futures advisories, Swing Trader’s Insight and Trade or Fade. He also writes the futures trading blog at www.futuresinsightblog.com. Scott has written articles for a number of futures publications and has done numerous futures trading seminars, including seminars for both the CBOT and CME.

Scott offers his customers the knowledge he has gained from his more than 25 years of experience in the futures business. Scott is accepting new clients at this time.

Scott lives in suburban Chicago with his wife and three children. In his free time he enjoys coaching his children’s sports and various other athletic activities.

Primary Sidebar

Get Blog Updates

Subscribe to our blog and receive a daily email with information on market insights, trading tips & strategies.

Trustpilot

Footer

Site Navigation

  • Frequently Asked Questions
  • About Us
  • Customer Reviews
  • Contact Us
  • Futures Blog
  • Open a Futures Trading Account
  • Media Resources
  • Fund Your Account
  • Legal Notices

Contact Us

StoneX Financial Inc.
Daniels Trading Division
230 South LaSalle Suite 10-500
Chicago, IL 60604
+1.312.706.7600 Local / Int'l
+1.800.800.3840 Toll-Free
+1.312.706.7605 Fax

Connect with Us

Trustpilot
Risk Disclosure

The StoneX Group Inc. group of companies provides financial services worldwide through its subsidiaries, including physical commodities, securities, exchange-traded and over-the-counter derivatives, risk management, global payments and foreign exchange products in accordance with applicable law in the jurisdictions where services are provided. References to over-the-counter (“OTC”) products or swaps are made on behalf of StoneX Markets LLC (“SXM”), a member of the National Futures Association (“NFA”) and provisionally registered with the U.S. Commodity Futures Trading Commission (“CFTC”) as a swap dealer. SXM’s products are designed only for individuals or firms who qualify under CFTC rules as an ‘Eligible Contract Participant’ (“ECP”) and who have been accepted as customers of SXM. StoneX Financial Inc. (“SFI”) is a member of FINRA/NFA/SIPC and registered with the MSRB. SFI does business as Daniels Trading/Top Third/Futures Online. SFI is registered with the U.S. Securities and Exchange Commission (“SEC”) as a Broker-Dealer and with the CFTC as a Futures Commission Merchant and Commodity Trading Adviser. References to securities trading are made on behalf of the BD Division of SFI and are intended only for an audience of institutional clients as defined by FINRA Rule 4512(c). References to exchange-traded futures and options are made on behalf of the FCM Division of SFI.

Trading swaps and over-the-counter derivatives, exchange-traded derivatives and options and securities involves substantial risk and is not suitable for all investors. The information herein is not a recommendation to trade nor investment research or an offer to buy or sell any derivative or security. It does not take into account your particular investment objectives, financial situation or needs and does not create a binding obligation on any of the StoneX group of companies to enter into any transaction with you. You are advised to perform an independent investigation of any transaction to determine whether any transaction is suitable for you. No part of this material may be copied, photocopied or duplicated in any form by any means or redistributed without the prior written consent of StoneX Group Inc.

© 2023 StoneX Group Inc. All Rights Reserved

  • Risk Disclosure
  • Privacy Policy
  • California Residents Privacy Notice
  • Terms of Use
  • Back to top
 

Loading Comments...
 

You must be logged in to post a comment.