As most investors know, hundreds of strategies and ideas exist which can be used to capitalize on any market. Undoubtedly, everyone has a different way of putting his or her money to work. Because of the development of modern portfolio theory in the country’s best management schools, one investing behavior that every money manager encourages is diversification. “Diversification is your ONLY friend,” does not only apply to stock picking or bond fund investing, but also applies to investing and trading futures markets as well.
While it is important to not have all of your eggs in one basket, one must be careful putting this theory into practice. After all, how does one know what baskets are similar? Whether referring to the diversification of long term futures holdings or markets that are day-traded, futures traders who are seeking to diversify should be looking to find markets that are as uncorrelated as possible. Market correlations are never 100% predictable because markets tend to trade on their own metrics. Plus, there are a lot of hidden links in the markets that surprise many new traders. However, there are tools available that can help us determine what is correlated and not correlated over recent time periods. This blog article will focus on how to sort through the clutter and see a couple of ways we can track this data.
Finding (non)correlations
A comparison between two markets can be positively correlated, negatively correlated or non-correlated. Positively correlated markets tend to move in lock-step with each other. In some cases, these positive correlations are easy to spot, like in the case of gasoline and crude oil or silver and gold. As one market moves, the other tends to move in the same direction. Thus, diversification would not be achieved by buying both gold and silver, or gasoline and crude oil.
Negatively correlated markets tend to move in completely opposite directions. When one market is up the other market is down. We see perfect examples of negatively correlated markets when looking at currency swaps. The US Dollar and the Euro have perfectly negative correlations. While negative correlations do offer diversification opportunities, they might not be the best strategy to employ. A trader long the dollar and short the Euro would discover the strategy would achieve almost neutral returns due to the fact the dollar and Euro have pricing models that offset one another. Buying and selling markets with perfectly negative correlations tend to achieve very neutral returns. Although negatively correlated markets could offer the opportunity for futures spreading, there might be better opportunities spreading markets that are less correlated.
When looking for diversification opportunities it is important to focus on markets that are non-correlated with each other. It is best to be in positions that will profit independently. Thus, a portfolio that has positions moving in lockstep is unnecessary. Trading in markets that have no correlation to one another can help avoid huge account value swings and provide more focused returns. In the new global economy though, where markets tend to be more linked than ever, non-correlated markets can be difficult to find. Thankfully, we at StoneX are equipped with tools that can do the dirty work for us.
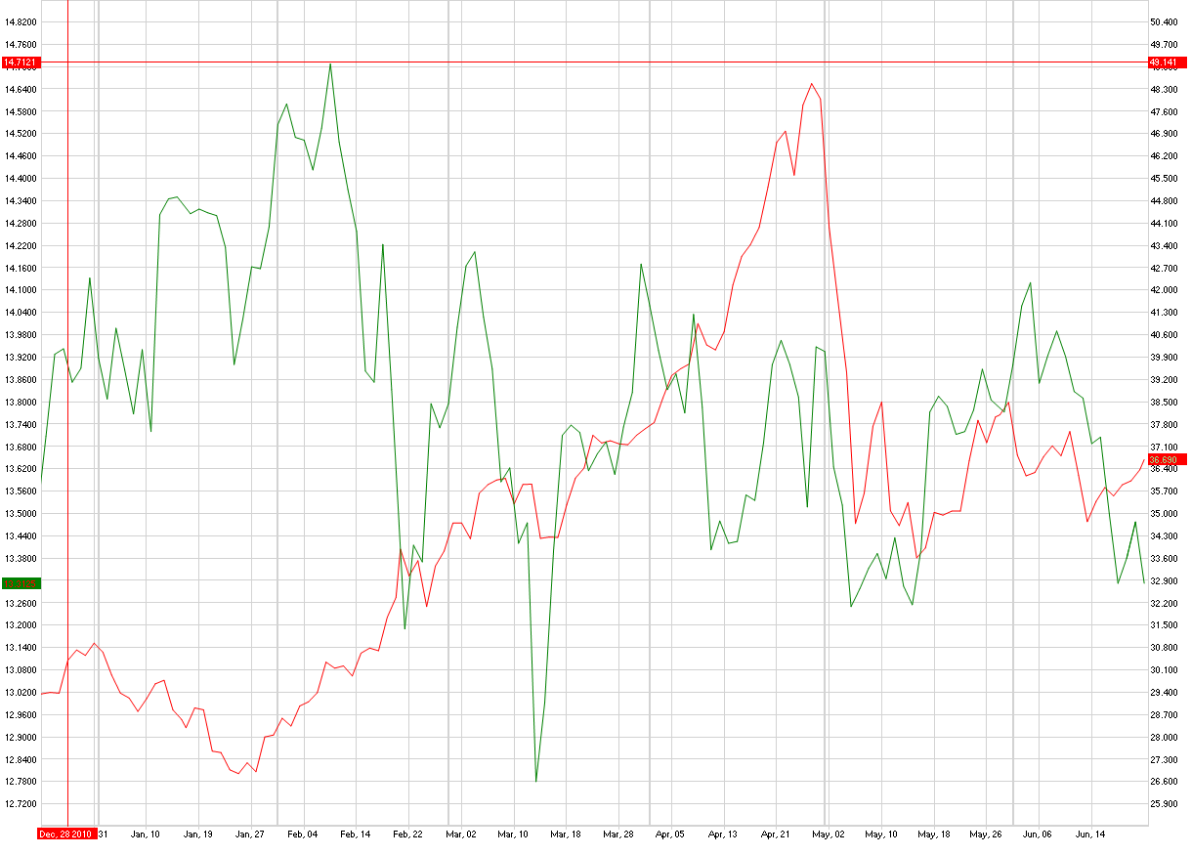
There are two ways we could go about finding which markets move together. First, we can simply get a charting program and overlay 2 charts on top of one another; Below is an example of soybeans and silver, and how they have traded over the last 6 months. The red line represents silver with its prices on the left axis, while the green line represents soybeans with its prices on the right axis. We can see from viewing the chart that over the last 6 months these contracts have been slightly correlated, but not anything near a perfectly positive correlation which would sway us from investing in both markets.
Any trades are educational examples only. They do not include commissions and fees.
Second, we can find correlations by the using the tools made available by Moore Research. Moore Research, or MRCI as they are known, are a statistical trade research company that develops correlation studies, seasonal trade patterns and various scenario analyses. Through their inter-market correlations research page, MRCI does the correlation research for us by providing the graph below to show us how correlated markets are over the last 180 trading days. They even gage each commodity pair by applying numbers that measure how correlated markets are. The higher the number the more correlated the markets are. The closer the number is to zero the less correlated they are. A positive number shows positive correlation, whereas a negative number shows negative correlation. A market pair at zero would be perfectly un-correlated, while a number closer to 100 would indicate the market moves are more positively or negatively correlated. By simply looking at this chart provided by MRCI, one can see how correlated their market of choice is to every other futures market traded.
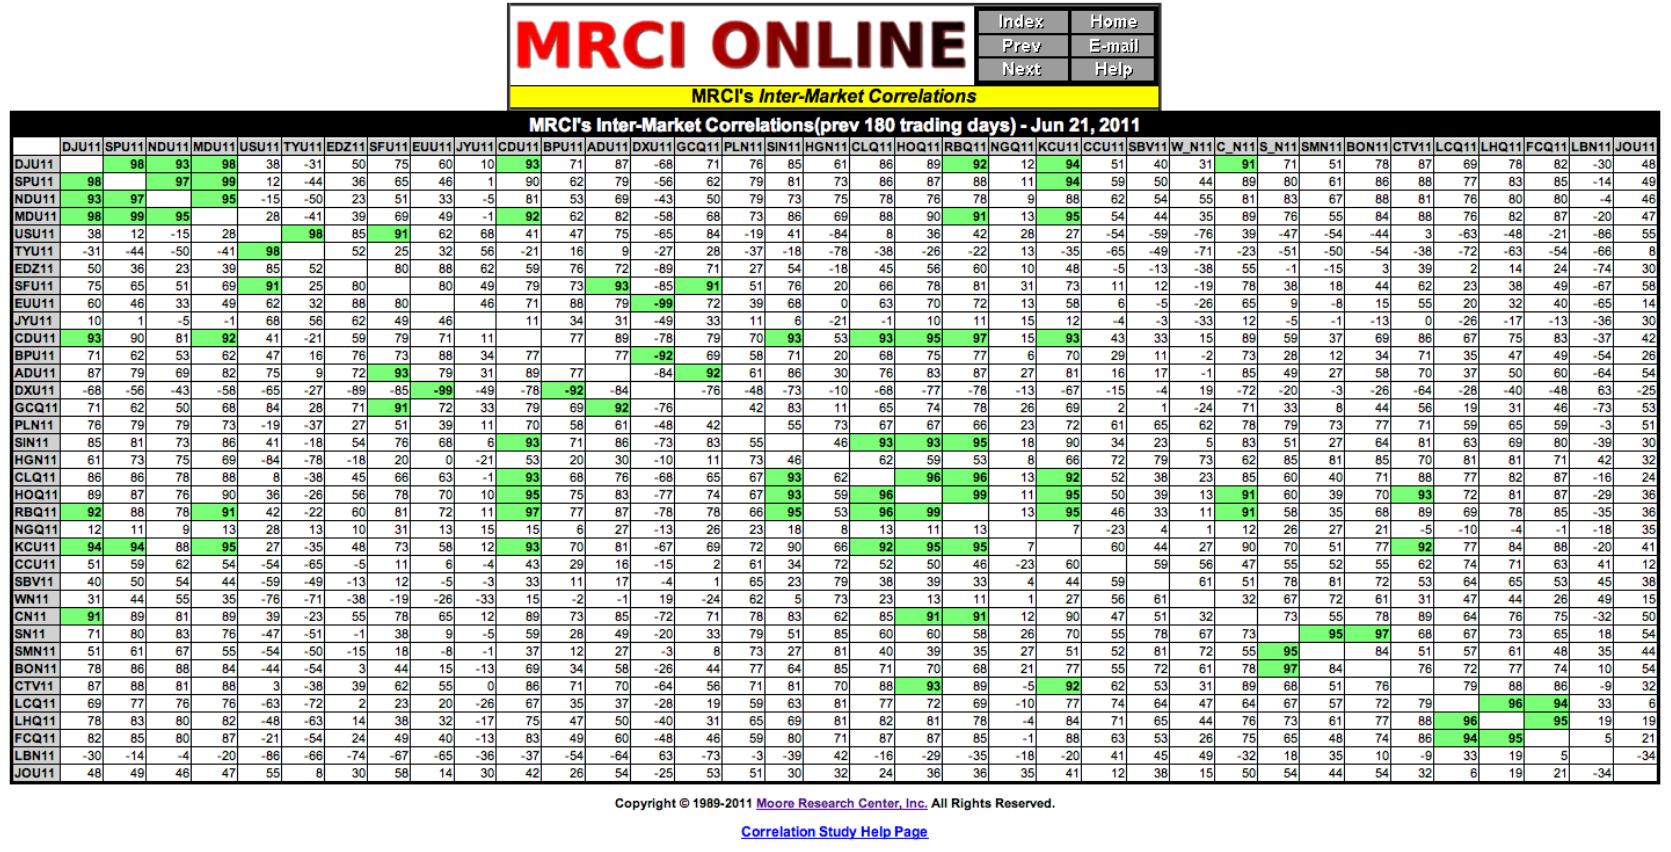
Screenshot courtesy of MRCI Online
Any trades are educational examples only. They do not include commissions and fees.
Using the data above we can find a few markets in which to focus our attention. Remember, we are searching for diversification, so we are looking for neutral correlations. For example, Nick is a technical trader. He wants to use technical analysis to trade two markets independently. He seeks liquid markets that have little correlation. By looking at the chart above, I would recommend he look at trading markets like the e-mini S&P and Natural Gas. As he moves forward, he may notice correlation changes, but based on the last 180 trading days the e-min S&P and Natural Gas should provide the market action that he is looking for. There may be better markets fundamentally or technically, but in this case Nick wants to make sure his markets of choice don’t move in lock step with each other.
Any modern portfolio theory promotes the value of diversification to help hedge market-wide risk. To put this type of theory into action, one needs to know how each market reacts to another. We at StoneX have the tools to help traders does just that.
